-
Product Ideas
Have a Domo product enhancement idea? Submit or upvote on ideas in the Ideas Exchange.
-
Ideas Exchange
Suggest & vote on new features you would like to see implemented in the Domo Product.
-
Data Connections
Ask questions about Connectors, Workbench, Cloud Amplifier and get best practices from Domo peers
-
Connectors
A space to troubleshoot connector errors (like authentication and sync issues), best practices for building or customizing connectors, and API and writeback options.
-
Workbench
Workbench discussions including configuring and running jobs, managing data types and schema, troubleshooting upload errors, and working with large datasets. Ask questions about scheduling and automation, version updates, system requirements, and SQL query behavior.
-
Cloud Integrations
Discussions around federated and cloud integration topics, such as Cloud Amplifier, Snowflake, Databricks, BigQuery, Oracle NetSuite, and other data warehouse or lake connections. Ask questions about authentication, auto-preview settings, cost implications, pass-through SQL, and integration configuration.
-
Data & ETL
Ask questions about Magic ETL, SQL DataFlows, DataFusion, Dataset Views and get best practices from Domo peers
-
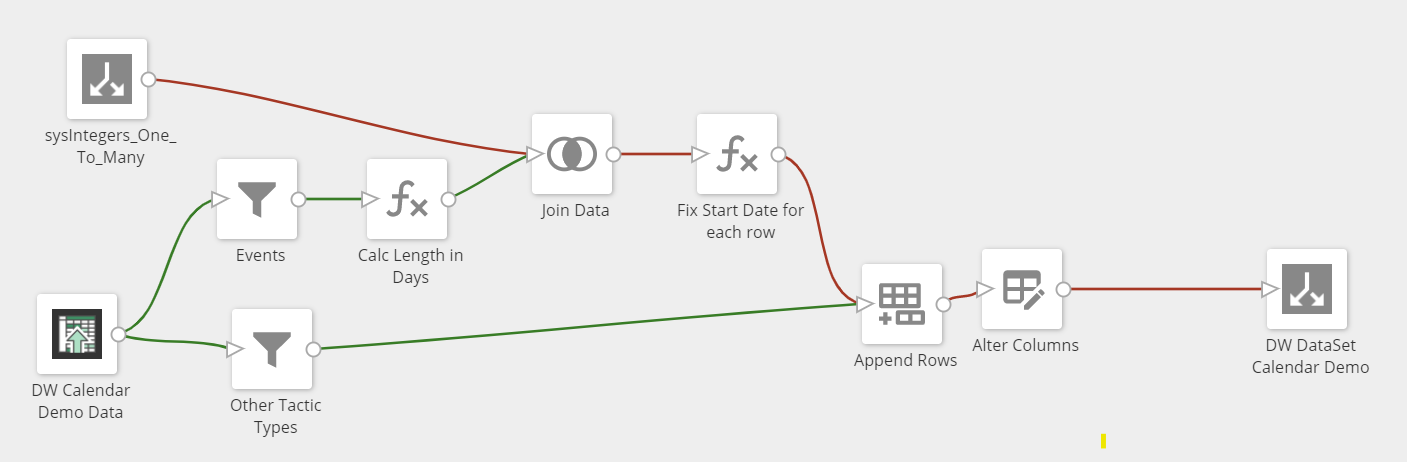
Magic ETL
Magic ETL discussions including data transformation flows, formula editor use, tile functions (e.g., Pivot, Join, Group By, Rank & Window), and handling schema and datatype conversions. Ask questions about workflow logic, preview behavior, visual editing features, freeform SQL, and performance/error tuning.
-
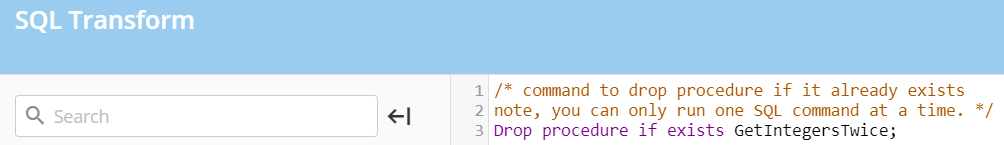
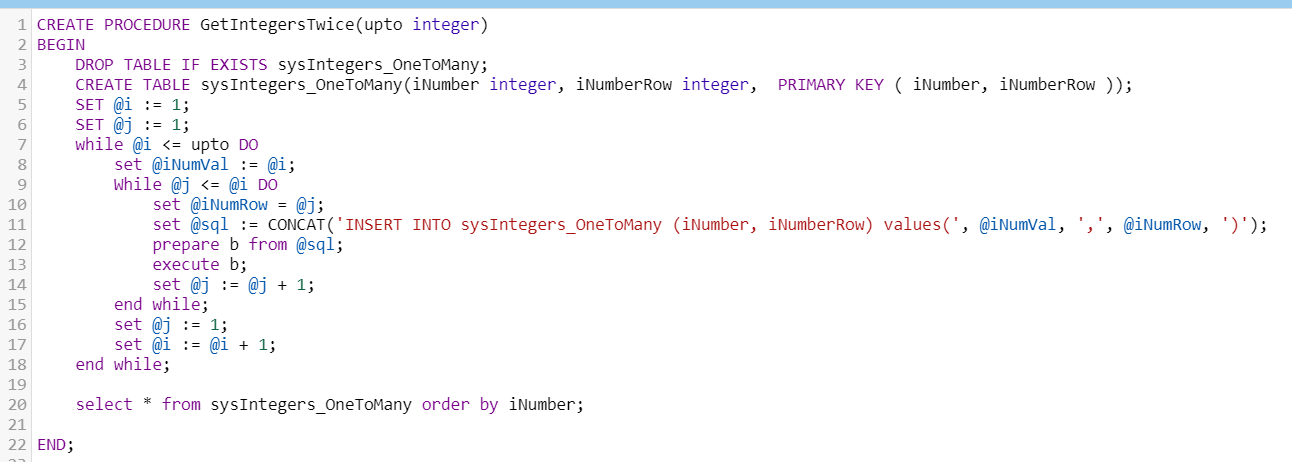
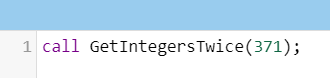
SQL DataFlows
SQL DataFlows discussions including creating and managing SQL dataflows, API automation (e.g., via Python), error resolution (such as row-count mismatches or timeout limits), and SQL transform logic. Ask questions about performance optimization, execution time limits, workflow error troubleshooting, API integration, and SQL view or query visibility.
-
Datasets
Datasets discussions including DataFusion and Dataset Views, dataset sharing and permissions, importing and formatting data (e.g., CSV/XLSX), dataset granularity and filtering behavior. Ask questions about data merging and snapshots, API metadata access, header changes in imported files, and export/view limits.
-
Visualize & Apps
Ask questions about Beast Mode, Cards, Charting, Dashboards, Stories, Variables and get best practices from Domo peers
-
Dashboards
Dashboards discussions including Cards, Dashboards, and Stories—covering topics like card formatting, dashboard navigation, filtering logic, and data visualization behavior. Ask questions about layout consistency, dynamic labeling, drill-downs, access permissions, inter-dashboard navigation, and export options.
-
App Studio
App Studio discussions including building multi-page apps, custom navigation, themes, forms, filters, queues, and component behaviors. Ask questions about popup forms, filter persistence, control visibility, mobile access, theming and branding, embedded workflows, and publish workflows.
-
Pro-code Components
Pro-code Components discussions including building and debugging Domo Bricks or pro-code apps, app lifecycle management (e.g., manifest.json), and dataset or workflow integration. Ask questions about permission configurations, app-to-dataset writebacks, form security, PDF export, workflow initiation code, and use of the web-based Pro-code Editor.
-
Charting & Analyzer
Charting & Analyzer discussions including chart types (e.g., period-over-period charts, bullet charts, pivot tables, heat maps), tooltip and data label configuration, filter behavior, and time-based visualization logic. Ask questions about date selector binding, custom calculation displays, sorting order, annotations, chart alerts, and multi-metric formatting.
-
Calculations & Variables (Beast Mode)
Calculations & Variables (Beast Mode) discussions including creating and troubleshooting calculated fields, using variables in Analyzer, nesting Beast Modes, and leveraging FIXED and window functions like RANK or aggregation logic. Ask questions about variable scoping, date and running total calculations, error handling (e.g., divide-by-zero, row filters), ETL vs Beast Mode placement, and performance optimization.
-
AI & Data science
Ask questions about DomoAI and get answers from Domo peers.
-
Domo AI & AI Chat
Domo AI & AI Chat discussions including AI readiness tools, AI Chat interface behavior, AI agent creation and workflows, and AI dictionary or metadata configuration. Ask questions about AI Chat sessions reports, chat history visibility, publication syncing, AI agent errors, and dataset readiness governance.
-
Managing AI
Managing AI discussions including AI Playground usage, AI project setup, and AI model management within Domo. Ask questions about AI Academy episodes, AI agent errors, AI readiness guidance, and image/upload workflows.
-
Jupyter Workspaces
Jupyter Workspaces discussions including Notebook execution, scheduling DataFlows, error troubleshooting (e.g., “no output” or workspace down), and package or library support within the workspace. Ask questions about AI features, file share connectors, domojupyter APIs, Jupyter via Workflows, and data science resources.
-
Automate
Ask questions about App Framework, Workflows, Domo Bricks, Domo Developer, API and get best practices from Domo peers
-
Workflows
Workflows discussions including Task Center automation, form-based workflows, conditional logic, alerts, and code-driven tasks using Code Engine (JavaScript/Python). Ask questions about email triggers, append/writebacks, dataset logging, API integration, error handling, and workflow-task interactions like Projects & Tasks or dashboards.
-
Alerts
Alerts discussions including setting up card-based and dataset-based alerts, conditional notifications, and monitoring alert execution behavior. Ask questions about summary number triggers, email content values, multi-dimensional logic, non-firing alerts, and configuration differences across dataset types.
-
Distribute
Ask questions about Domo Everywhere, Scheduled Reports, Mobile and get best practices from Domo peers
-
Domo Everywhere
Domo Everywhere discussions including embedding dashboards and cards (public vs private), filtering and access control, performance and layout behavior, and API/client ID management. Ask questions about license tracking, text selection in embedded content, export limitations, embed errors, and configuration of .env and datasetRedirects.
-
Reporting
Reporting discussions including Scheduled Reports, Report Builder, and Slideshow Publications. Ask questions about bulk managing scheduled reports, CSV/PDF export formatting, report layout customization, interface changes, and admin visibility of reports.
-
Manage
Ask questions about Governance Administration, Approvals, Teams, Alerts, and Buzz and get best practices from Domo peers
-
Governance & Security
Governance & Security discussions including managing People, Groups, Roles, Teams, Approvals, and PDP, plus sandbox environment access and activity log investigation. Ask questions about role delegation, dynamic group attributes, SSO/SCIM onboarding, governance toolkit usage, and governance dataset visibility and reporting.
-
Navigation & Productivity
Navigation & Productivity discussions including navigation layout and customization, Projects & Tasks usage, Goals tracking, and Buzz chat functionality. Ask questions about custom icons in navigation, level-specific dashboard creation, workspace navigation behavior, and project/task visibility in Buzz.
-
APIs
APIs discussions including Domo REST APIs, Python SDK, Java SDK, data import/export, and App API use cases. Ask questions about authentication (client ID/secret), rate limits, error handling (401/403), dataset append/update, and embedding or snapshot automation.
-
Add-ins & Plugins
Add-Ins & Plugins discussions including Microsoft add-ins (Excel, PowerPoint), Google Slides, and other third-party integrations. Ask questions about installation errors, legacy vs new plugin behavior, refresh failures, template formatting, iframe embedding, and version differences.
-
Domo Community Gallery
Watch how our Customers are using Domo to solve their complex problems.
Featuring real-world use cases, customer success stories, and community-shared workflows or integrations. Learn how our customers are using Domo to solve their complex problems.
-
Product Releases
Domo support and product teams are here to live-answer questions about the most recent product releases. Please post questions in this Forum board for all users to benefit (rather than submitting a support ticket).
-
Domo University
Domo University discussions include self-paced training, instructor-led courses, virtual/in-person learning, and certification paths. Ask questions about course content updates, certification exam tips, platform onboarding improvements, and training resource formatting or errors.
-
Community Forums
-
Getting Started
Welcome to Domo's Community Forums! You'll find everything you need to get started in this category.
-
Community Announcements
Get the latest from Domo's Community Team.
-
Social Groups
-
Archive
Old or outdated content that could still be found helpful.