Best Of
Magic ETL Join Tile Alterations Field Search
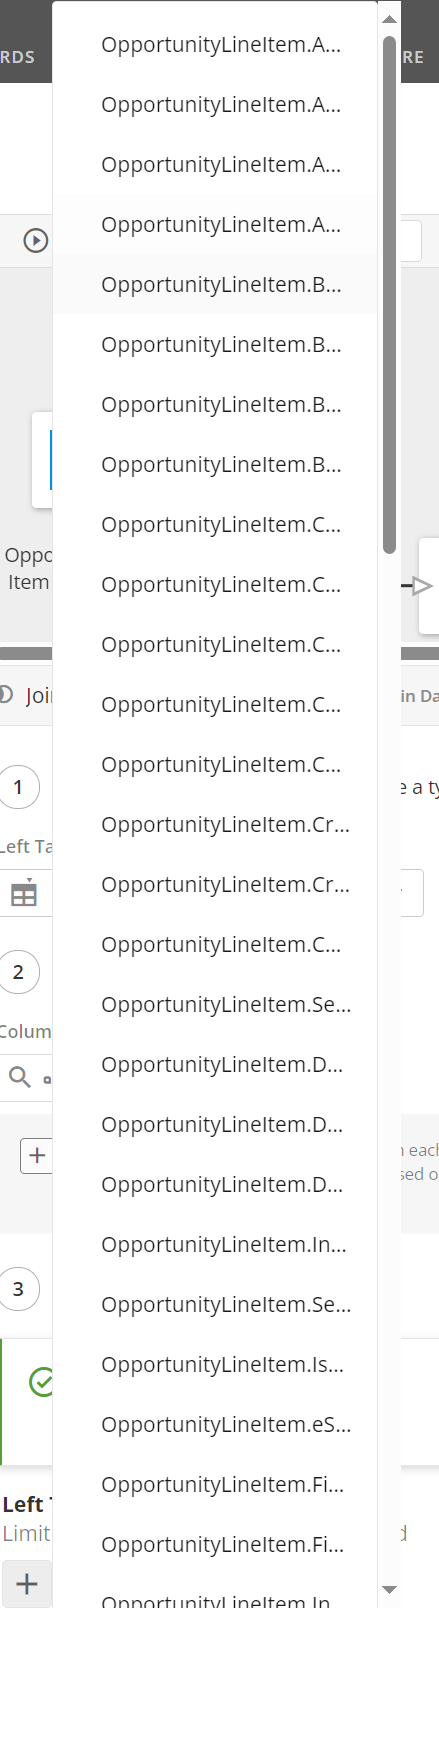
We have really appreciated all the quality-of-life updates to Magic ETL over the past few months! I have a few ideas to improve a pain point we frequently encounter when building ETL's. Some of our standard schema is verbose and requires field name prefixes when ingesting from certain systems. When we attempt to alter certain columns in a join (when a preceding tile to make the change is not optimal or functional) we have issues finding the correct column. I have included a screenshot to give an idea of what the UI looks like for one of our commonly used datasets.
Our idea is three fold:
- Let us control the width of the popup sub-menu to see more of field name string to ensure we select the correct field.
- Add a search function, similar to the join conditions section, to make finding the desired field easier.
- If we select a field, and it turns out to be the wrong one, let us change that field "in place" without having to delete the alteration and add a new one.
Any one of those 3 additions would make a massive impact on our Magic ETL experience.
Thanks!
Austin - HS1
Pivot table enhancements
I would like for the ability to choose whether Pivot Tables expand/retract vertically rather than horizontally.
Right now, each level is stored in it's own column. This often takes up a ton of unnecessary screen real estate. I'm envisioning something more like this…

VS how pivot tables currently function


Dataset Direct Impact Reporting
In Data under the Overview tab, there is a section called Direct Impact. This data is very useful when doing Dataset maintenance as it will give you an idea of how that data is used.
We would like to see this data reported in Domostats | Datasets so it could easily be pulled into any reporting that might be highlighting dataset usage.
 SherryR
Card Name vs Card Display Name
There are many times I need to display a specific name on a card and there are duplicates of that same card name however they are looking at different datasets. It'd be great to set an internal name vs a display name to display one thing but have a unique name to more easily differentiate between the different cards.

Toggle Auto Preview on/off at the instance level (Company Settings)
As Domo admins, we should be able to control whether Auto Preview is automatically enabled when users launch Analyzer in our Domo instances.
This is especially important as Cloud Amplifier is implemented because of the potential cost implications of, for example, querying Snowflake each time a user modifies almost anything in Analyzer. Users would still be able to turn on Auto Preview as needed (just as they can turn it off now).
In the Domo Everywhere publisher/subscriber model, control over Auto Preview is critical because subscriber users may be less familiar with best practices, potentially resulting in numerous unnecessary queries generated through Cloud Amplifier. I want to be able to manage this setting on my subscriber instances from my publisher/primary instance. At a minimum, we should be able to manage it through the Governance Toolkit.
 akeating
Image Not Displaying on Mobile App
Hello,
We've connected images out of our private (Salesforce) instance to an HTML table and we're able to see the images (headshots) within our Desktop instance of App Studio and Domo - as well as in the mobile view on desktop in App Studio.
However, the images are not populating within the actual mobile version of Domo / the app.
Support pointed out that mobile devices are not caching our credentials (like the desktop version is) to allow for us to see the image within the mobile app. Any suggestions / fixes?
dan_s
Make the Flex Table the GOAT chart
I feel like the Flex Table has the potential to be the Domo GOAT chart, but it's so locked down, I end up never being able to use it. Here are my suggestions to unlock its potential:
- Allow for multiple series, so you can group at more than one level. i.e.: first two columns are Region, State
- Allow to set a manual vertical scale for the charts and/or give the option to sync the scales across the charts
- Build in the ability to Trellis/Pivot. i.e. the rows could be states, and you could see the percent change across multiple product categories
- Create a 'no change' symbol, or an option to have no symbol with no change
- Allow the change color to propagate to the graph
- Add chart types:
- horizontal box plot
- Waterfall
- Outlier/SPC
- Bullet

Dynamic (Contextual) Annotations
Annotations are extremely useful as a visual cue on cards to explain why calculations may differ on or following an event. Currently these annotations are generalized to the dataset/date.
Annotations could be further expanded to be row-level contextual, only visible when filter conditions are met.
Suppose Store A is holding a special event for 50% off all items on 04/09/2024. Store B is not participating in the event. It would be useful to create an annotation which would be visible when viewing Store A data, but not visible when viewing Store B.
Perhaps this could be sourced from a column in the dataset — Store A's Annotation column would contain '50% Off All Items' on the 04/09/2024 record; whereas Store B's Annotation column would be null for that day.
 chapman
Variable Example Use Cases
The Domo team has created a few example variable pages to help get your ideas started. Here are a few examples of how to use Variables in Domo, these pages are publicly embedded and have links to the variable set up & sample beast mode codes.
Variables General Example Page -
- Dynamic calculations with dynamic columns - Great for ad hoc analysis.
- Heat Map with dynamic categories - Great for identifying trends in the data.
- "What If" target/benchmark calculator - Provides the user the ability to change the target based on column values.
- Temperature conversions - Quick and easy temperature conversions.

Variables for Period over Period Example Page -
- Custom date range comparison - This allows full comparison between 2 time frames.
- Period over period & Year over Year - This uses pre-defined lookback windows to review the data.
- Dynamic periods - Allows users to swap the axis of a chart between time frames.
- Exclude last month(s) - Great for delayed data like financial data.

 JedP
Enable Drilling on Table View
If a card has a drill path the drilling capability goes away when it's in table view, if drilling can be enabled for both the default view and the table view of the card that would be extremely useful.