Best Of
Custom CSS for App Studio Apps (+ maybe code injections)
Would love if App Studio allowed for custom CSS and potentially JS code injections. This would bridge the gap between the no-code App Studio and the all-code bricks. I am imagining something similar to Squarespace's setup (but for reports instead of a website) where everything is no-code unless you specifically go to the custom CSS and code injection settings. Non-coders would not even notice the option is there, but it would be amazing for users with more specific styling and functionality needs who don't want the work or maintenance of the pro-code editor.
I would love this feature since my team builds cards in the Card Analyzer because it is quick, easy, and accessible to all coding levels. Building in the pro-code editor is somewhat off-limits since it requires coding knowledge to maintain and edit, but at the same time we are limited by very simple App Studio theme settings. With this feature, the coders on the team could customize styling while still allowing everyone to work on the content of the app. I would imagine JS code injections would not affect card functionality (otherwise the pro-code editor would be more useful), just the app elements. Personally, I would prioritize custom CSS over code injections, but both would be great!
 katrina
Re: Need to display total count to be displayed on Grouped bar chart.
One trick you can do is turn on tooltips. Put something in there you can count like names or an ID. Then go to dataset labels in text put in %_TOOTIP1
Made you a video on it:
If you or anyone else wants to see more of my Domo tips, you can signup for my newslettere here:
AND / OR subscribe to my YouTube channel:

Re: Taking an average of the dataset an comparing
@damen Made you a little video I hope this is what you need:
The issue is you might want to use a variable instead of a dropdown filter because if you use a filter you are taking data out of the chart which is ruining the average.
https://www.dashboarddudes.com/newsletter-sign-up
Need to display total count to be displayed on Grouped bar chart.
How to display a total rows count for each individual. Our major need to show the total inside the same chart.No option in chart properties to select show total rows count under data label settings.Is it possible to display a total for each series in a domo grouped bar chart.
 Pari
Pari
More Versatile Tabs Positioning in App Studio
I really like the tab Elements, I think it's a very efficient use of space on a dashboard. However, I would like to be able to position cards NEXT to them. Currently, I can only position cards above or below them.
- Here is what I’m able to do currently:

- What I would LOVE to be able to do, is to clean this view up by positioning the tabs beside a taller card, especially in the “Auto Width” view where I have plenty of left and right real estate to play with.
- In this example below, I’ve put a large spacer element where I would like to position the tabs. I think this would work great and would give users a lot of variety in design options.

Has anyone used the Indeed Connector?
Hi, my company is exploring utilizing the Indeed Connector in Domo. We are hopeful that this connector may improve some internal processes but have had hardships with Indeed in the past.
For anyone who has experience with this connector:
(1) Did the data provided eliminate or at least significantly reduce the need to manually pull/review performance metrics from the Indeed platform?
(2) Have you encountered any issues from the Indeed side that interrupted the connection? Indeed seems to constantly be changing their rules and accessibility, so I am curious if the API Publisher Key or the data being provided by it has ever been changed, especially to be more restrictive or disruptive to down funnel configurations (e.g. data labels/format, etc. being altered).
Pass Variables into a MagicETL from Workflows.
With the new workflow features on the horizon, I think it would be immeasurably valuable to pass output variables from workflows into Magic ETLs since workflows can execute ETLs already. For example:
An 'audit' workflow is triggered that evaluates a dataset for various criteria. As part of the evaluation it sets output variables. At the end of the workflow, it triggers a MagicETL via API but can pass in those variables to said MagicETL as part of it's execution.
Inside the MagicETL, assuming you pre-defined some optional "input parameters", those then become the values from your workflow execution. This would allow MagicETLs to be much more dynamic as those variables can be used in various MagicETL tiles to control things like filtering, formulas, or change the way my output dataset outputs a Replace/Append/Partition dynamically.
The scenerio I think best fits this idea is if I had some workflow that tries to identify missing data in a dataset by looking for missing dates in their entirety along with statistical analysis on historical record counts on that same day of the week for those missing dates. Once those dates are identified, I can pass those dates from my workflow into the MagicETL. Those dates can then be used in my ETL to only reprocess data for those missing dates as part of using them in my Filter tile and possibly change my output dataset configuration away from Parition replace to Append so those missing records are just appened to the dataset.
Another scenerio would be if I triggered a workflow the moment a new user logged in. Maybe I want to trigger a MagicETL related to a business process to get them inserted into various system level datasets we designed for auditing/monitoring and apps we've built. The workflow could trigger various ETL's, passing in that user as a variable to act as filter so the ETLs are only doing work on that one person. This would be much more efficient and ensure faster processsing speeds.
DomoDork
Domo Connections 2026: What do you hope to see?
Hello Domo Community!
Long time no see! I come to you with a question: What do you hope to see at Domo Connections this year?
We want to know how to make Domo Connections more meaningful for you so we can maximize the value these events offer everyone who attends. I have a few questions I'd love to hear the community's opinion on specifically:
- What session formats resonate with you the most? (Demo, fireside chat, technical deep dive, etc.)
- Since AI is THE thing right now, I'd also like to know specifically what you would like to learn about AI? so we can curate the content around what matters most to you.
- One of the best parts about Connections is coming together in person to network and catch up. Is there anything you'd like to see done differently with networking so you can find quality connections easier? (Pun intended)
If there's anything else not mentioned above that you would hope to see at Domo Connections this year, please let us know! We are open to any and all suggestions.

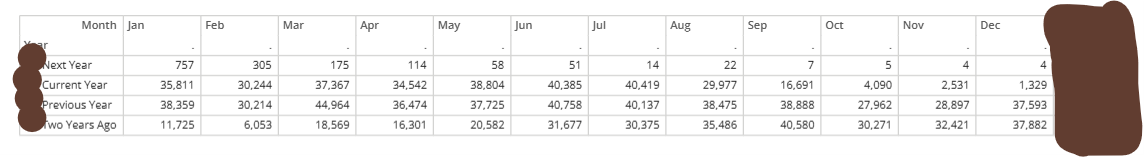
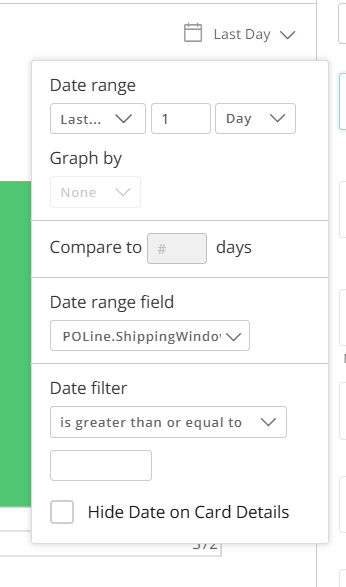
Last / Next Date Range Option
Recently captured this gap/challenge from a user in the shipping/logistics industry:
• We would like to see a "last/next" date range option added to the Date Range selection drop box in Analyzer, since this is a very common feature used in our industry.
• When you go into Edit Analyzer, and want to set the date range, there is currently no option for Last/Next. There is every other option, except this one. Instead of you have to get into the complexities of beast modes or variable date control with a workflow. Since last/next is a likely a common way users like to view data, It would be easier, if that option was available in below.
Thank you!

Domo DataStats Datasets
There is currently no way to map a nested Beast Mode to the formula for nested Beast Modes.
Examples:
Domo Governance Beast Modes dataset has a column for Beast Mode Formula.
Below is an example of a formula that is nested.
- (DOMO_BEAST_MODE(12768) / DOMO_BEAST_MODE(12764))
However, those # ID's aren't found in any other field in the Domo Governance Beast Modes dataset. The Beast Mode ID column is the ID for the Beast Mode, but it looks like: calculation_80fe8c64-2f5d-4d70-a97b-05503a9a285f
Switching to the DomoStats Beast Modes dataset, those # IDs do appear in the ID column, but the dataset does not have a formula column. There is no ID that maps to the Beast Mode ID column from the Domo Governance Beast Modes dataset.
Meaning, you cannot map to the formulas behind nested beast modes. I opened a support ticket, but they said that is the intended behavior and the mapping I'm after is a product enhancement. 🤨
