Best Of
Re: Custom CSS for App Studio Apps (+ maybe code injections)
I 100% agree, I am looking to do this for a few apps, and ended up here :) There is a lot of value, and I manage multiple apps, but I want to be able to adjust the styles for all of them easily.

Re: Coloring Option for only the rows title instead of entire rows
Hi,
After selecting the Apply Color rules to headers and setting the color rules .The final output is good as we we expected. Thank you.
 Pari
Pari
Re: Taking an average of the dataset an comparing
I like @DashboardDude 's variable suggestion. I went down a couple other rabbit holes that weren't working. I'll write up my implementation of his idea, but all credit to his idea.
This is my dummy data, where each lender has some different number of loans each year:
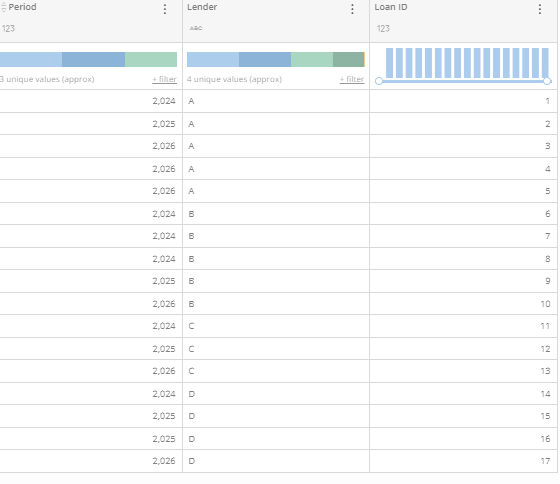
Without any variables or filters, my table would look like this:
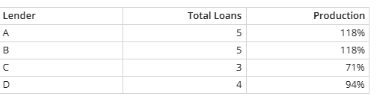
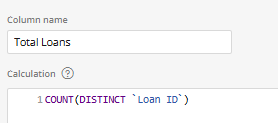
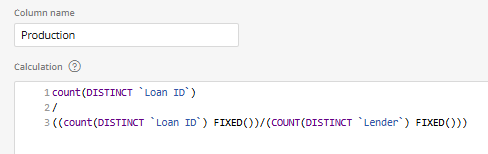
Based on these 2 BMs (I tend to use Domo's fixed functions, but I imagine these do about the same thing as your over():
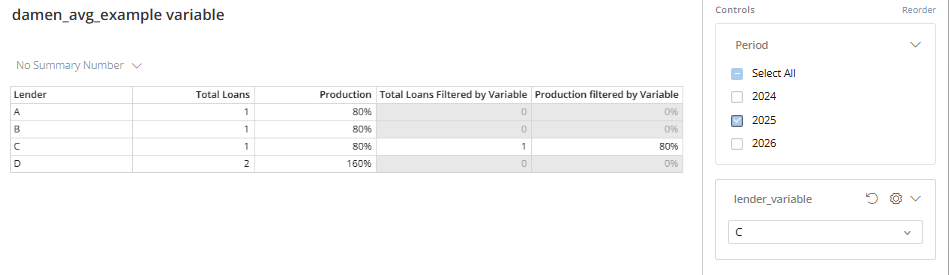
Adding a variable:
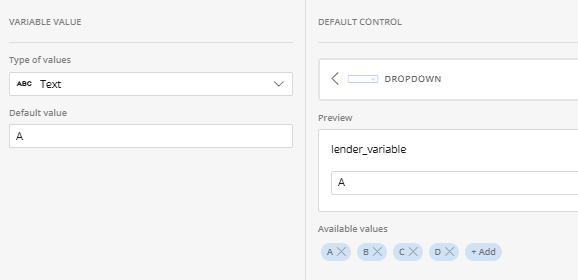
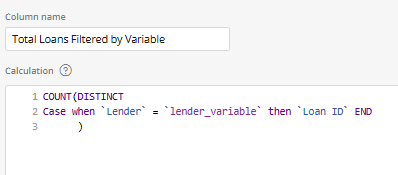
I adjust my Total Loans to only use the Loan IDs when the variable matches the Lender:
That works now to only give Totals and Production for the selected Lender:
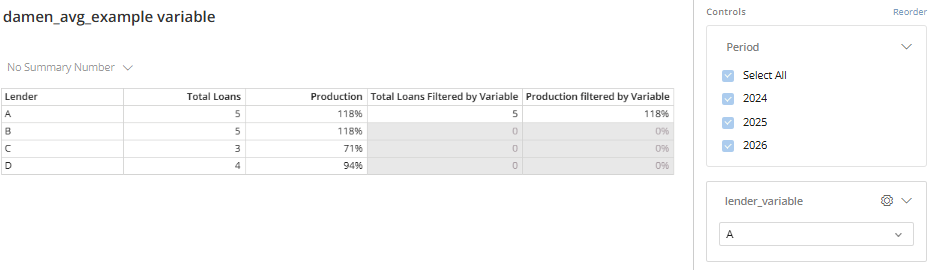
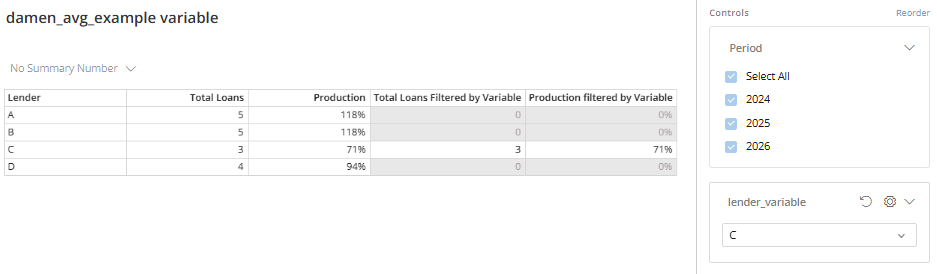
I can also filter the period, and still get the correct values:
Now I can use that production based on a variable to populate a Gauge:
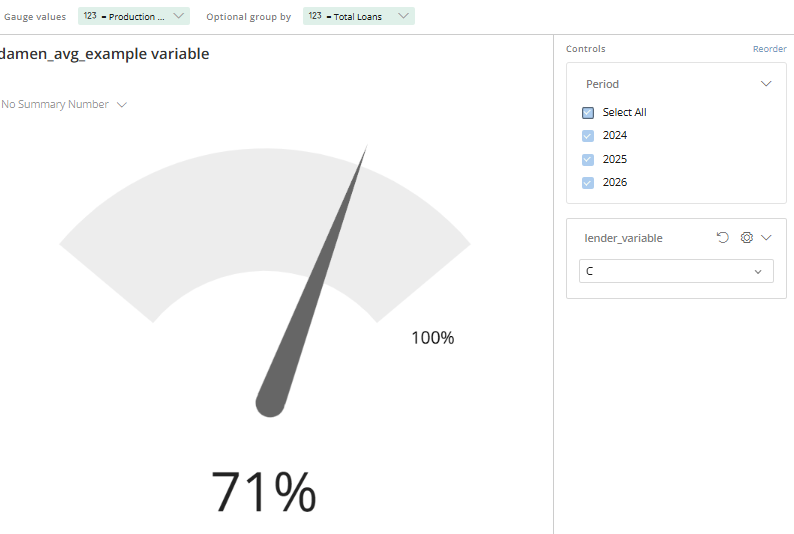
Some notes:
- Make sure to include the Control for the variable on your dashboard.
- If a user filters the Lender, this will give the wrong numbers. Don't include the Lender as a filter card, and if the user has the ability to add filters in the Controls, give them a warning about doing it for lender
- This is responsive to other filters, like on the Period.

Re: Custom CSS for App Studio Apps (+ maybe code injections)
Also an additional layer on top of this would be the ability to keep the custom CSS as part of the app theme when creating a new app and importing the theme from an existing app!
katrina
Re: There is no Line Label setting for Symbol Line Chart?
They likely were developed independently of each other. This would be a great idea for the idea exchange to recommend the Domo team implement and allow other users to vote on this.

Re: Need to display total count to be displayed on Grouped bar chart.
I find using the nested bar chart a great way to show the group total and still show the individual totals. Here's the KB article for it.

Re: Domo Connections 2026: What do you hope to see?
I love the connection tours. I think a miss is that people think it is a "substitute" for Domopalooza or I've had some people think it's a mini Domopalooza. I think it should be presented as a teaser for Domopalooza or something like that.
Also, I personally think the fireside chats aren't as engaging as people on stage think it is. The goal should be more to inspire rather than inform. Happy to discuss this more if you'd like.

Re: Dropdown filter: select all fields that contains a particular word?
@ellibot and @verytiredgirl - I put this question into CHIP to see what it came up with. What do you think of the response: Short answer: yes, that’s a current limitation.With a standard dropdown (multi‑select) filter, you can search for values, but you still need to check each item manually after typing the keyword. There isn’t a setting that automatically selects all items containing a word. If you want true “contains” behavior, you have two options:
- Use a
Match Valuesfilter and type the keyword (e.g.,contains Pipe). This filters the data directly without selecting individual items. - Or use a
variable + Beast Modethat checks if the field contains the typed text.
So the behavior you’re seeing isn’t a bug - it’s just how dropdown filters currently work.

Dropdown filter: select all fields that contains a particular word?
Example: I have a drop down filter for products.
I want to type "Pipe" and select all the products that contains the word "Pipe" in it. But I dont see it as an option.
That means, I have to individually select each product after typing "Pipe" in the dropdown search.
Is it a DOMO limitation, or is there a setting for this?