Best Of
Pivot Table Subtotal Control
If your column is doing a beast mode based on the individual line level in a pivot table the subtotal will follow that rule (i.e. if you are using max() in a beast mode).
It would be helpful to have a subtotal or total override if it's the case that you don't want subtotals to adhere to beastmode logic. i.e. you want the subtotal to be a sum of the max() number.
 rockchalk629
Dashboard Descriptions
I'd like the ability to add Descriptions to Dashboards and for that Description to be available in our Domo Governance Data
 user08845
Allow alignment of dropdown filters or dropdown variables in the cards
If you have a dropdown variable with a title and a dropdown filter with a label text property set and don't display the title of the filter on a page they don't line up. It'd be great to have more flexibility with the alignment to make sure things are put in place where I'd like them rather than having this off center.

 GrantSmith
Domo Governance - Chart Types
It would be helpful to see the Chart Type in our Governance Datasets. Right now I think we can just see if it is a Textbox or a Chart. It would be very valuable to be able to tag if it is a Table Card. I would like to add dynamic glossaries at the top of each dashboard to have hyperlinks to each table card on the page for quick access.
Magic ETL - Undo Button
Can we add an Undo Button to Magic ETL. This would be especially helpful when we accidentally delete a tile when clicking to drag it.
user08845
'Description' to be added in DomoStats Activity Logs
The 'Description' of every event is available in list of Activity when accessed through Admin Page but the column 'Description' is not available in the dataset of Activity Logs coming from DomoStats. Though logs have some details of certain activities but not for all and not as good as given in 'Description'. So one ends up analyzing certain events (eg Update Email, Whitelist IP, add Phone Number etc) first in Logs and then search for same event in Activity in Admin Page which in isolation is not as user friendly as dataset & cards of Activity Logs.
So, it takes lot of time to put the two pieces of information together as they are to be used little differently. We are experiencing this shortfall while doing number of analysis as Admins.
It is recommended to add the 'Description' column in the Activity logs of DomoStats or provide a method to combine the information available in both places.
Shailesh
Can you paint with all the colors of the web?
At the CST time of this posting, I had a far out idea – what if colors were a little more flexible in a couple of ways. Here’s a few ideas.
Today when changing colors on a visual, this fun experience occurs:

The change all button doesn't even have a warning before it causes the mass extinction of the other carefully designed cards colors! The results, in my experience is dashboards changing more times in a month than The Doctor (Doctor Who) changes actors throughout the show's history:

What makes it infinitely more entertaining is the reaction of the business users, especially the ones that are extremely particular about the color of their reports --- it's always the same story but it never gets old:

Anyway, if DOMO were to implement some functionality similar to the below image then three things would happen --
1.) Resources spent rebuilding color rules that will be yeeted into oblivion faster than an Elon Musk taking over his favorite bird website would no longer be a concern
2.) All the fun conversation that comes from the business when button roulette occurs would go away
3.) DOMO Dashboards in general would look even better because there would be more safety that work would be preserved so I think the developer base would spend more time making their visuals look exceptional

Being able to save multiple sets of color rules to datasets and being able to apply them to cards. That would be the dream.
Next topic, the color selection -- I think it's great that we can use a hex code to select any color... there are three things that would help us make even better happy little visuals

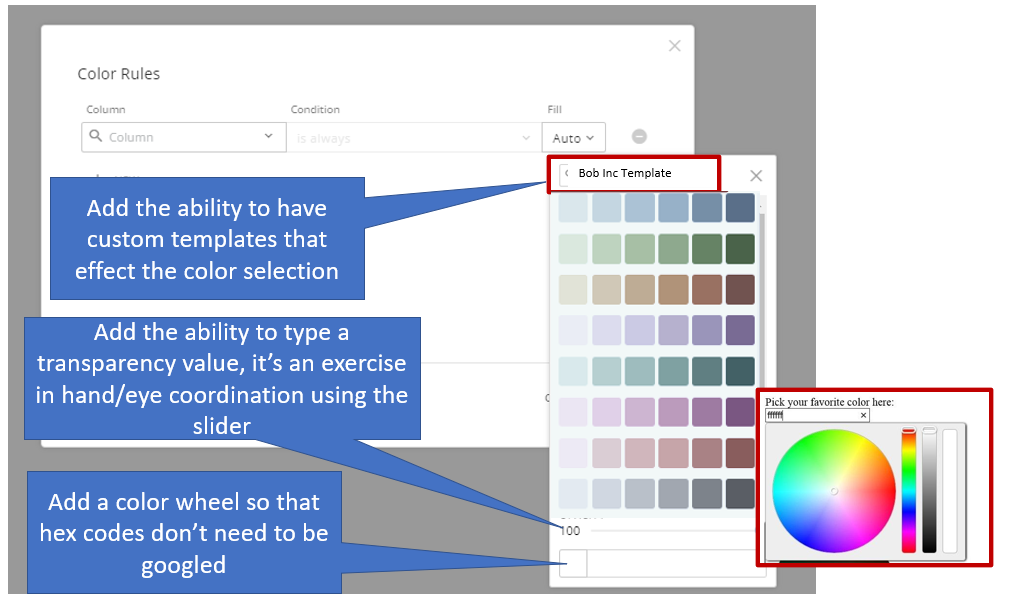
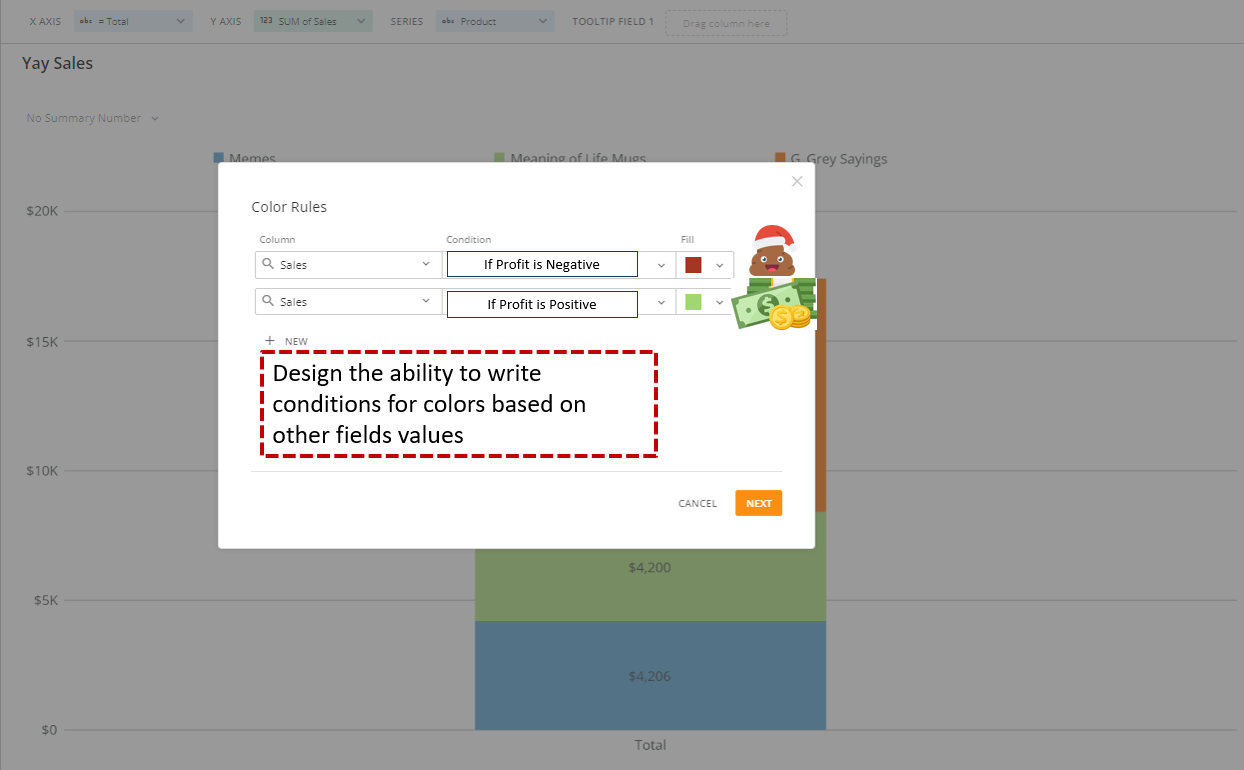
The next thing on my mind that would make our dashboards stickier than Coke and Mentos is setting color rules for fields that are calculated based on other fields. There are work arounds to this, but I'd want to use this in a more complex manner.
HERE is the ultimate chart and the dataset that goes with it. The company made $17k in Sales we hit our goal. Let's celebrate!

Guess what? The 4.2k in mugs lost tons of money. Which isn't good for the company... Every party needs a pooper that's why they invited G_Grey! Let's make those Sales Green if Profit is positive and brown if Profit is down, thanks the meaning of life mug.
One final thought -- has there been any thoughts around 'chart themes' or additional color schemes. Sometimes, when making visuals that compare 'this year' vs 'last year' for example I can differentiate them with lighter colors or darker colors, and with opacity... but having different outlines or fill types (such as cross hatching or gradients) here's a few simple example:


Merry Christmas, I'm off to paint my dashboards with all the colors of the wind.

 G_Grey
Split out the Grant option 'Export From Domo'
Currently, there's an option to enable/disable users from 'Creat[ing] Scheduled Reports and export[ing] to email, print, PowerPoint, CSV, and Excel.' I would like to retain the ability to share the cards/dashboards but would like to have an option of preventing users from accessing the underlying data behind the chart views etc (so that users don't promote own analysis without alignment or endorsement from Data team etc or gain access to sensitive data). It would be great, for a future update, to have an option in 'Cards & Pages' grants that limits user from exporting as a CSV/excel file but allows other exports.
 amehdad