Best Of
Re: Is it possible to have multiple bars(metrics) on y-axis?
@Lucky21 I would also look into the Grouped and Stacked Bar chart. You would need to create a separate beast mode for each Type/Metric combination (i.e. Pen Revenue, Pen Forecast, Pencil Revenue, Pencil Forecast)

Re: Integrate with Monday.com
We have successfully leveraged Jupyter Workspaces and some simple python code to pull Monday board data into DOMO. Happy to share if anyone is still experiencing this challenge. Warning though, the flexibility and frequent editing of Monday boards can create havoc. Make sure you have strong understanding/collaboration with Monday board owners.
 JFRdevo
Re: Analyzer: Don't Automatically Choose Chart Type and Columns
Would it be possible to have a blank canva when creating a card in the Analyser, instead of having a card, usually a bar chart, populated with random columns from the selected dataset?
Everytime I create a new card, I have to start by removing those columns and removing the summary number which is also random, and so that's already several useless clicks without having even started to build anything...
thanks in advance
EmmaH
Re: Monthly Net Working Days
You might have to modify your dataset first, as you'll need to have all of the dates in your data if you want to calculate before the end of the month. I would probably start in Magic ETL with the Domo calendar dataset, via the Domo Dimensions connector, filtering it down to the appropriate date frame, and then left joining your dataset to it on your date field. This would keep all of the dates in the calendar intact. Then you could write a beast mode to count the Net Working Days, something like:
count(distinct case when dayName != 'Sunday' then dt end)

Re: Identifying what data came from which connector on a card.
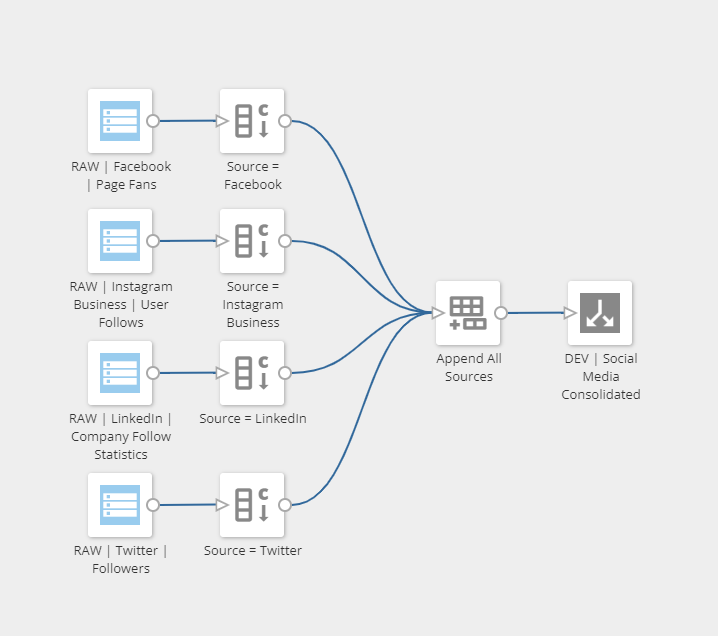
Hello @Parkerains, this will depend on how you have the Magic ETL dataflow set up. One solution to this would be to use the "Add Constants" ETL tile in your dataflow if you are appending your data sources together. Once you have finished creating the dataflow logic for each of your respective data sources, you can place a constant tile before the sources get appended together.
For this, you would need to use the same column name for each ETL tile (I use "Source" as the column name for this example). Then, you can input the unique name of the data sources they came from (i.e., Source = Facebook, Source = Instagram Business, etc). Since they are all appended to the same column, you can use this column in a filter on your dashboard to toggle between the various data sources in addition to having a clear distinction for where the data came from.
Please also note that the batch IDs for the cloud-based connectors provide a reference for how many times the dataset has updated. This can be utilized in a variety of ways, but the _BATCH_ID_ column does not provide any descriptive information about the connector itself.

Re: Monthly Net Working Days
@robinmathew131 Domo also has a calendar in Domo Dimensions with a isHoliday flag and a isWeekend Flag. So you can use that too to find working days to get to Net Working Days

Re: YouTube Connectors Using YouTube Account Username and Password
Hi @MrDomo
Do you have an enterprise account and you're wanting to pull the specific channel's videos? YouTube makes it a bit difficult as you have to log in / authenticate as the brand page account and not the enterprise account.
You account name would look something like *****-###@pages.plusgoogle.com. It'll be the same password as your main login account.

Color blindness & creative solutions
After the recent Domo XCanva Challenge, I am a bit more aware of when I am coloring outside the lines in producing a result. I just created a blank brick for a large table (simulated here in smaller version screenshots) that includes rankings on several columns. The request includes heat mapping on the columns. Since this is in a Domo brick, I produced my own heat rank.
Then I realized I had not accounted for people with color blindness. So I added functionality - a checkbox in the bottom corner. When checked, my table changes the colored heat map column backgrounds to white and displays black and white patterns for people who can't distinguish color.
Then I started wondering what creative solutions the rest of you might be implementing.


Re: DOMO chart doesn't sort in Month order? help
Just to expand on what @Jonathan53891 is suggesting. You are able to use different columns in your display and sort. So you can display (Jan, Feb, Mar: the text values), but can sort on a numeric field to make sure they display in the proper order.


Re: OKTA CONNECTOR reg.
OKTA's System Log API keeps data around for 90 days (source). It should be possible to get data for the last 30 days. Since Domo provides the API connector they'd need to be the ones to change the code to pull 30 days instead of 7. As Colemen mention you can log an idea in the idea exchange or you can possibly log a support ticket to see if the development team can make the change.