Best Of
Option to disable hover border for cards on dashboards
I believe that a recent'ish update has added a light blue border when users hover over cards on a dashboard. Having the option to disable this behavior would be a great improvement. For some cards, particularly some DDX bricks, the border breaks the sense that the card is an element on the page.
I have an album showing the difference here:
Domo provided Code Engine Package Documentation
Provide documentation on code engine packages that Domo offers and what they do. This would really help increase visibility with utilizing AI (internally, via the MCP server, and externally by viewing a knowledge base article) to build out workflows. This would especially be helpful for non-technical people that want to build out workflows.

Provide Field Definitions for Domo Stats and Domo Governance Reports
There are knowledge base articles listing out which fields are included in each report, but those fields aren't defined anywhere. Some field names can be a bit ambiguous and it would be nice to have definitions of what each field means.
Make Locked Cards and Locked Dashboards Behave Consistently for Sharing Permissions
There’s an inconsistency between how Domo handles locked dashboards vs. locked cards, and it’s creating a lot of unnecessary confusion.
When a dashboard is locked, users who aren’t the owner (and who don’t have “Manage All Cards”) can’t change who it’s shared with, which is exactly what you’d expect.
But when a card is locked, users with Edit Cards (but not Manage All Cards) can still add or remove people from the share list, even though they aren’t the owner. Support confirmed this is “working as designed,” since locking a card only protects the content, not its sharing permissions.
The mismatch feels counterintuitive, and it’s tripping up both my team and our customers. It would be great if locked cards followed the same rules as locked dashboards so sharing behavior is consistent and predictable.
PII Detection
While there is a 3rd party solution in the app store (PII Vault), I think Domo should have automated built in PII governance tools integrated into the toolkit. There could be a UI in the governance toolkit where you tick off various standard PII patterns to look for (SSN, Phone, Birthday etc) or even let you define a custom rule. Domo then scans all datasets looking for those patterns and writes out a log of potential datasets/columns that it thinks might sensitive into a table. Admins could then use this data to go review datasets and apply necessary controls around it.
 DomoDork
Facebook Ads connector — upcoming Facebook breakdown change (effective August 6, 2026)
Facebook recently announced a change to how they handle three specific breakdowns in their Ads Insights API, and it affects the Domo Facebook Ads Insights connector. We wanted to give you a heads-up ahead of the effective date.
What's changing
Starting August 6, 2026, Facebook will require these breakdowns to be enabled per Ad Account before their API returns any data for them:
impression_device(and any breakdown combination that includes it)hourly_stats_aggregated_by_audience_time_zonefrequency_value
Until an Ad Account is enabled, Facebook's API — both synchronous and asynchronous — will return no results for these breakdowns. This is a Facebook-side restriction, not a Domo connector issue.
Does this affect you?
If you use the Facebook Ads, Facebook Ads Advanced, or the Facebook Ads Advanced Multi Account connector, and have selected any of these three breakdowns — including via the "apply to all Facebook accounts" option — you'll want to take action before August 6. If you don't use these breakdowns, no action is needed.
What to do
Enable the breakdown for each affected Ad Account in Facebook Ads Manager. This has to be done on the Facebook side, per Ad Account — Domo doesn't have a way to enable it for you.
If you have Ad Accounts you're not sure are enabled, check Ads Manager directly, or reach out to your Facebook account rep.
Questions? Drop them below or reach out to Domo Support.
Tasleema
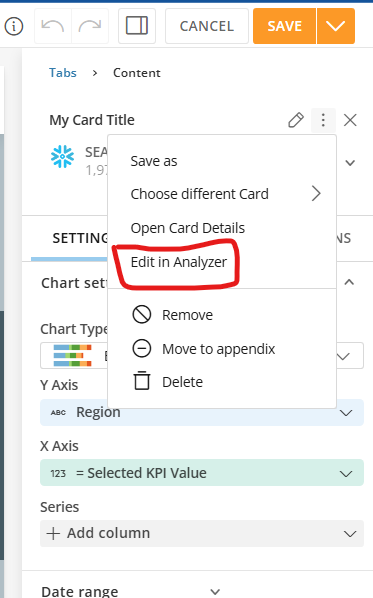
One-click shortcut for "Edit in Analyzer" in App Studio
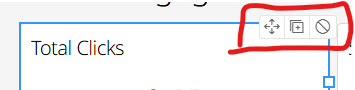
Please move "Edit in Analyzer" out of the three-dot overflow sub-menu in App Studio and make it a direct, one-click button embedded in the top-right toolbar when a card is selected.
Clicking through a sub-menu hundreds of times a day just to tweak a visualization or dataset is a massive productivity bottleneck. Pulling this option out into a visible shortcut embedded right in that top-right action menu would save developers endless clicks and significantly speed up the app building workflow.
 vash_ps
Add Emphasis Controls to Line Graphs
Emphasis Controls in a line graph would allow card creators to choose which line (from a Series of lines) should be emphasized. I think this is most valuable if the emphasis is "locked" (can't be changed by users). Alternatively, it could act as a "default" emphasis (allowing users to change emphasis by hovering over other lines or the legend).
Today, this emphasis can be added by user actions, but it isn't preserved by default or shown to other users. If a line graph has a Series of lines, users can hover over one line or an entry in the Legend. Doing so emphasizes that line. Other lines turn a light grey color, and their value labels are hidden. The emphasized line has value labels added.
This emphasized view is a classic strategy for data visualization. In the textbook "Stortytelling with Data" with Cole Nussbaumer Knaflic, Chapter 4 is dedicated to this kind of strategy. Academic research into the psychology of vision has proven that certain pre-attentive attributes (like color, hue, and size) in data visualizations will capture a user's attentive immediately and with great effect. This medium article also discusses some examples, including a line graph with emphasis: https://medium.com/microsoft-power-bi/data-storytelling-101-the-magic-of-pre-attentive-attributes-522da9785f36
This is especially powerful when we want to visualize "noisy" data. Imagine a line graph with 100 lines. It's visually confusing, overwhelming, with no clear focus. Viewers likely can't read data labels. A lot of data is visually "lost" due to overlaps. Emphasizing just one of these lines allows us to tell a clear story: this might represent an average, a new methodology, or an outlier. And the rest of the data is preserved for context, making it clear how the data we're emphasizing relates to the rest of the data we have.
Currently, Analyzer can get close to this functionality if we add color rules turning all lines grey and then a rule coloring our preferred line. What this can't achieve is allowing data labels on just the emphasized line, though. A control in analyzer to emphasize one line in a line graph would support this classic data viz strategy, empowering better storytelling.
Looking for Guidance on Google Analytics and LinkedIn Analytics Reporting in Domo
@MarkSnodgrass and I have been working on a Member Engagement Dashboard and have had success connecting Salesforce Marketing Cloud. However, we've run into some challenges with Google Analytics and LinkedIn Analytics. We've attempted to build the connections ourselves, but the reports and available data don't seem to align with the metrics we're hoping to track. We thought we'd reach out to the Domo community to see if others have encountered similar challenges or have recommendations on the best approach.
Our goal is to create a consolidated view of member engagement across:
- Website activity (Google Analytics)
- Email engagement (Salesforce Marketing Cloud)
- Social media engagement (LinkedIn)
Some of the metrics we're hoping to track include:
- Website sessions and page views
- Traffic to key member resources and program pages
- Email opens, clicks, and engagement trends
- LinkedIn impressions, engagement, and follower growth
- Overall trends that help us understand how members are interacting with our content across channels
We're specifically looking for recommendations on:
- The best connectors or datasets to use
- Whether we're accessing the correct reports within Google Analytics and LinkedIn
- Any ETL transformations that may be necessary
- Best practices for structuring a dashboard that combines engagement data across these channels
For context, this dashboard is intended to help us better understand how members engage with our digital content and communications over time.
Any guidance would be greatly appreciated. Thank you!
Significant improvements to AI Chat
For participants in the AI Library beta, we are excited to announce some significant improvements to AI Chat.
Users now have the ability to ask complex, multi-part questions about their data, enabling more nuanced and detailed inquiries.
Additionally, the system can now handle questions that span across multiple DataSets. While cross-dataset joins and unions are not supported, the system can query multiple datasets independently and synthesize the results to provide comprehensive answers.
AI Chat can perform more in-depth analysis with longer conversations, giving users the ability to engage in extended discussions about their data without losing context.
AI Chat now includes support for unstructured data in the form of Documents, broadening the types of information that can be analyzed and queried.
Finally, AI Chat fully supports visualizations of your data. You can now ask AI Chat to ‘Show’ you a card or ‘Create’ a card on your current dashboard or App.
