Best Of
Re: It's easy to remove Duplicates.....How do I KEEP only the Duplicates in a Dataset?
Try this:
Items you will need:
Input table for your dataset.
Group by
2 Filters
Join
Output Dataset
Connect Group by to your input dataset.
In step 1) put the field you want to check for Duplicates.
In 2) - also put the field you want to check for Duplicates, but do a Count on it and name it "Count"
Connected this Group By to a filter - and filter for "Count Greater Than 1"
Drag another connector from your Input Dataset to the Join, and drag a connector from your first Filter to the Join (basically joining the dataset to itself, after grouping and filtering). Join these two based on the field you were checking for duplicates.
Connected your Join to 2nd filter - and filter for "Count is not null"
Connect your Filter to an output dataset - which should produce a table showing you ONLY rows that have >1 of the field you were checking for.
Optionally - you can also do a Select Columns between the 2nd filter and the output dataset, selecting all rows except the 2nd copy of the field you were looking for duplicates on. Because both input datasets will have that field, it will appear twice in the final set unless you remove it using this method.
Good luck!

How to clean up clutter - User Conference Jan 2022 notes
If you would like to replicate the dataflow showed in the presentation, go here - https://doc.clickup.com/d/h/8895x-1107/6de82f6ad073c84/8895x-147
You can copy the code at the bottom of the page, open up a new Magic ETL 2.0 canvas in Domo and use the keyboard shortcut for “paste” (command + v on a Mac) to get the flow onto your MagicETL canvas. You may need to scroll down to see it on your canvas.
If you’re interested in learning more about the MajorDomo Deputy, which can leverage this type of dataset to manage your Domo environment at scale, feel free to reach out to us at interest@crystalballers.ai
Re: Budget Amount and Gauge Card Setup
Hi @AJ2020 ,@jaeW_at_Onyx and @GrantSmith ,
I did try to find a solution for the above posted problem and I was able to get it done using a HTML table. Below I am attaching a screenshot for the table card and beast mode using which I have created the card.

Beast Mode for Graph Column :
CONCAT(
'<div>
<div style="width:',(AVG(`Budget`) / AVG(`Budget`))*20 ,'%;Text-align:left;float:left;color:#5D5D5D">
<b>0%</b></div>
<div style="Text-align:left;Width:',(AVG(`Budget`) / AVG(`Budget`))*20 ,'%;float:left;color:#5D5D5D">
<b>20%</b></div>
<div style="width:',(AVG(`Budget`) / AVG(`Budget`))*20 ,'%;Text-align:left;float:left;color:#5D5D5D">
<b>40%</b></div>
<div style="Text-align:left;Width:',(AVG(`Budget`) / AVG(`Budget`))*20 ,'%;float:left;color:#5D5D5D">
<b>60%</b></div>
<div style="Text-align:left;Width:',(AVG(`Budget`) / AVG(`Budget`))*20 ,'%;float:left;color:#5D5D5D">
<b>80%</b></div>',
/*<div style="background-color:#ffffff;Text-align:left;Width:',(`Budget` / `Budget`)*0 ,'%;float:right">
<b>100%</b></div>*/
'</div><br>','<div style="background-color:#224D75;height:10px;width:',(SUM(`Used`) / AVG(`Budget`))*100 ,'%"></div>')
Beast Mode for %Used Column :
case
when (SUM(`Used`) / AVG(`Budget`)) * 100 > 100 then CONCAT('<font color=#fa5e5e>','<b>',ROUND((SUM(`Used`) / AVG(`Budget`)) * 100,2),'%')
when (SUM(`Used`) / AVG(`Budget`)) * 100 < 100 then CONCAT('<font color=#226F78>','<b>',ROUND((SUM(`Used`) / AVG(`Budget`)) * 100,2),'%')
end
Do let me know if you find this useful.
-
Thanks,
Anas Ahmed

Re: How to calculate Percentage in each Series - Bar graph
Hi @Dharshini, in 'Chart Properties' -> 'Data Label Settings' -> 'Text' -> '%_PERCENT_OF_CATEGORY', you can show the data in each stacked bar as a % against the total along each for your ACT Lower values, showing the bars data exactly as your first image.
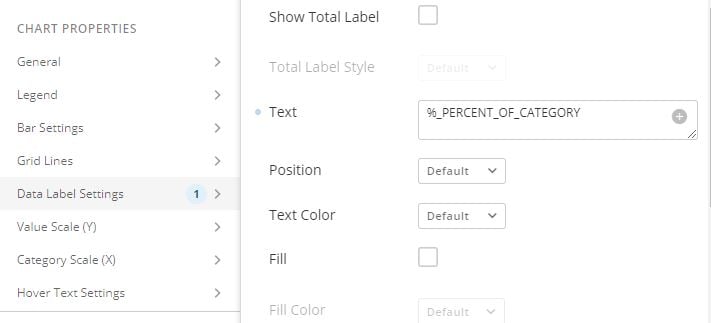
Hope that helps.
 amehdad
Re: Pivot card
Hi @eriena, just in case you haven't already, you can learn more about pivot table cards here: https://domohelp.domo.com/hc/en-us/articles/360043429473-Pivot-Table.
On ordering the product names, the default option is alphabetical order but using the other arrowheads across your columns, you can sort in any order you like.
As for having empty records show, try this chart property option and see if it displays all products when February is selected.
 amehdad
API Tokens - Tracking Usage / Governance
From a security standpoint it'd be great to see when / where an API Token is being used. Alternatively give the activity log have a flag that a token was used vs a user logged in the system. When someone leaves there's no easy way to track which APIs are used and what needs to be changed.
 GrantSmith
Individual / Group Landing Pages
If Domo could allow each login to have its own Landing Page, or by Group.
This will allow the Landing Page to be relevant to each Department / Team or subsidary company.
For example, Sales / Marketing Team can see their monthly stats and goals.
Customer Service Team can see their monthly calls received and average call time and customer satisfication ratings. Identify currently which customer is calling the most with which issue.
#landingPage
 Domofied
Re: Cant get the percentage of the total!!!
Have you tried using OVER() ?
Here's an example I used for the included screen shot.
SUM(`Extended Price`) / SUM(SUM(`Extended Price`)) OVER()

 swagner