Nesting Dimensional Data Fields in Domo Visualizations
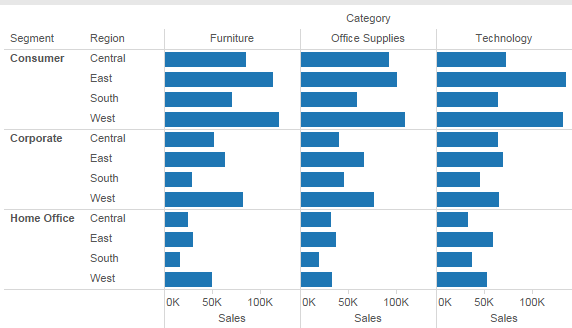
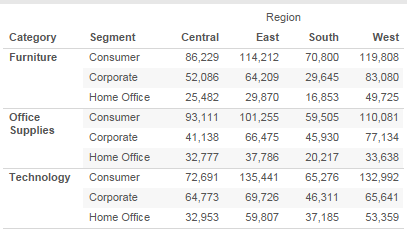
I have a dataaset with the following Dimensions: Product Category, Region, Customer Segment - with Measures being Sales and Profit. I'd like to build a Text Table or a simple Bar Graph card that nests the dimension fields (i.e. displays them in a hierarchy) where Product Category and Customer Segment are along the Y axis and RTegion is along the X Axis. When I try to build vizzes like the ones below, I don't seem to be able to "nest" Dimensional fields. Am I missing something?
Please see attached screenshots, and thanks for any and all suggestions. Best wishes, Michael Martin

Comments
-
0
-
Hi @MichaelMartin - Have you tried doing this in a Sumo Card? (From any page in Domo, "Add Card" > "Sumo Card") This is similar to a PivotTable in Excel, where you can nest your dimensional fields, and even enable subtotals for each sub-grouping.
1 -
@MichaelMartin, did AdamT's reply help you out?
0
Categories
- All Categories
- Product Ideas
- 2.1K Ideas Exchange
- Connect
- 1.3K Connectors
- 309 Workbench
- 7 Cloud Amplifier
- 10 Federated
- Transform
- 666 Datasets
- 120 SQL DataFlows
- 2.3K Magic ETL
- 827 Beast Mode
- Visualize
- 2.6K Charting
- 90 App Studio
- 46 Variables
- Automate
- 198 Apps
- 489 APIs & Domo Developer
- 98 Workflows
- 24 Code Engine
- AI and Machine Learning
- 23 AI Chat
- 4 AI Projects and Models
- 18 Jupyter Workspaces
- Distribute
- 118 Domo Everywhere
- 284 Scheduled Reports
- 11 Software Integrations
- Manage
- 145 Governance & Security
- 13 Domo Community Gallery
- 49 Product Releases
- 13 Domo University
- Community Forums
- 41 Getting Started
- 31 Community Member Introductions
- 117 Community Announcements
- 5K Archive
