Best Of
Re: Pivot Table - More control over subtotal rows
The suppress single line subtotals work up to a certain point and with certain limitations from what I've tested in the past:
- Sometimes you want some subtotals to show even when there is a single line, to drive consistency in presentation. In Mark example the second block (104471) is the perfect representation of this, if you select the remove single line subtotals then that will be presented differently than all of the other entries. Which makes it less intuitive and harder to read for the untrained eye.
- For this to work you need to make sure you put the line that makes it unique in the right position from left to right as of when you want to stop the groupings from happening (usually a unique identifier to the highest level of granularity to be displayed). Which might not always align with what the desired order of the output is.
Having an option to select how many levels of Subtotals we want would be ideal and grant the level of customization many users are looking for.
Visually if our Dataset would be something like this:

And we want our Pivot table to show the columns in the following Order: Customer > Month > Invoice > Total, but we want our Subtotal Rows only to be present at the Customer level and to always be present at that level, without the Suppress single line totals we get:

If we select the option, then we still get subtotals at the month level when there are multiple invoices and we lose the Total row for Customer C.

If we rearrange to have the Invoice as the second column (highest granularity) we do get all subtotals to only be for the first column, but still miss to have one for column C (this is way more noticeable if you style your subtotal rows, which I've done in this last screenshot to better illustrate how those can easily be missed)

As you can see it'll be hard for the untrained eye to know that the C row has the same level of importance as the A Total since it's not even highlighted in the same way.

Is it possible to render an exisiting card inside a Domo Brick?
Hi All!
Does anyone know of a way to 'embed' an existing out-of-the-box card inside a domo brick? I realize there are custom visualizations via PheonixChart to create custom visuals, but I have an idea for a dynamic, table driven landing page and want to take an existing card URL (e.g <instance>.domo.com/kpis/details/<card id> and use the domo brick as a container to display cards for a given card URL.
That way, I can use governance data to grab useful cards depending on the end-user and display those cards inside a domo brick to mimic dynamic card content on a dashboard/page.
 DomoDork
Re: Is it possible to render an exisiting card inside a Domo Brick?
So, I found the API to render an image of a given card id :) That is good enough to at least show the cards as images in their most updated state and render them in a brick that I can make clickable. :) Here's my example code to do this.
var renderCardUrl = /content/v1/cards/kpi/{{card_id}}/render?parts=image,summary;
var json_body = {
"queryOverrides": {
"filters": []
},
"width": 99,
"height": 46,
"scale": 1
};
var img = domo.put(renderCardUrl, { body: json_body });
Note that it currently errors and doesnt return the base64 encoded png string because of this API's need for authentication. But this still may be useful for other folks out there.
Thats the only thing I'm stuck on as I don't think its a good idea to expose the dev token in bricks.
So, two questions. One does anyone have documentation on domo.put() and the parameters it takes for the I assume it's the same as standard http.request(url, headers, body) but just want to confirm.
Secondly, are there any default domo functions available in bricks that let me read credentials from the account credentials store? That would get around exposing tokens.
I could get around this via Jupyter notebooks or magic ETL scripting tiles but I'd prefer to only render card images dynamically as needed based on the end user who visits the landing page, rather than going out to every card in the instance, rendering them and then storing them for retrieval later. Thats a ton of wasted API calls.
Thanks!
DomoDork
Re: Is it possible to render an exisiting card inside a Domo Brick?
@MarkSnodgrass @GrantSmith - Right after I posted my last response, I found a partial solution. All I did was go into a card → share menu → embed to get the direct <iframe> code Domo generates for embedding in a brick.

The giant downside doing it this way however is that you must enable embedding on every card so Domo can generate an embed ID. If I want this to work on a landing page where I want various cards relevant to a particular user/group/dept to dynamically show up on their landing page, I'd have to find a way to programmatically trigger APIs to enable embed on every card and figure out a way to trigger said API as soon as a new card gets created as well.
So, it's not ideal but at least we know the basic idea of embedding cards in domo bricks is possible. I will still go over to the ideas exchange and pitch the idea of adding an alternative to share → embed as that is geared more towards external embedding of cards in other external applications. What is really needed is just an API/URL endpoint that lets me embed a card internally without the need of enabling embed on a card by card basis.
Cheers!
DomoDork
Re: I want to add the Min, Max and average lines to a stacked graph ...how do I do that?
Thanks. I thought your series was breaking up bars into multiple segments. But you are just using is to add colors.
If you set the Colors using Color Rules, then you can avoid using Series. This will allow you to keep the min max and avg values:



Re: Count Attribute Instances instead of Projects
It's always helpful to have a small sample of the dataset to help understand the structure of the data. However, from your description of the fields, I'm assuming that your data may look something like this:

With each project having a single row of data and multiple columns of data that contain the different "go live" dates for that project.
What I think you will need to do is to use an ETL to convert your data to look more like this:

With one row of data per project, per GoLive number.
You could even then add calculations to the ETL to determine the Year for Actual Go Live and if the project was On Time.
This data structure will give you a separate count for each time a project has a Go Live that is on time versus delayed.
Re: Count Attribute Instances instead of Projects
I might be wrong, so right now your Dataset would be pivoted, so in a single Row per project you have up to 9 possible Go-Live Dates (with Initial and Actual) for each. Something like:

There are 2 approaches I can think of for this:
Beast Mode approach:
One that will return the number of times it was completed within the given window, which would look something like this but with 6 more lines for the other possible dates:
CASE WHEN YEAR(Actual Date1)=2023 AND Actual Date1 <= DATE_ADD(Initial Date1,INTERVAL 25 DAY) THEN 1 ELSE 0 END
+ CASE WHEN YEAR(`Actual Date2`)=2023 AND `Actual Date2` <= DATE_ADD(`Initial Date2`,INTERVAL 25 DAY) THEN 1 ELSE 0 END
+ CASE WHEN YEAR(`Actual Date3`)=2023 AND `Actual Date3` <= DATE_ADD(`Initial Date3`,INTERVAL 25 DAY) THEN 1 ELSE 0 END
Then a best mode to tell you the number of the dates that fall in the period, regardless of whether or not they were completed in the 25 days period:
CASE WHEN YEAR(Actual Date1)=2023 THEN 1 ELSE 0 END

+ CASE WHEN YEAR(Actual Date2)=2023 THEN 1 ELSE 0 END

+ CASE WHEN YEAR(Actual Date3)=2023 THEN 1 ELSE 0 END
And in your graphs you can do a SUM of these fields to get the total you'd expect. You can make this more versatile by having the Year and the Interval be Variables rather than hardcoded, so you don't have to redo if someone later ask, what about things that we achieve in a 7 day window rather than 25, or what if I want to know for 2022 instead of 2023. This with the table explained above will yield the following results:

ETL approach to unpivot (overkill for this request IMHO)
Then your ETL would look something like this (I know there might be more efficient ways out there, but this should do the trick):

The Make Date Pairsjust concatenates the actual and initial date for each of your possible options.

In the Select Columns, we choose only the key project information we want to keep available for charts plus the Pairs we created earlier. In the Dynamic Unpivot you select all the columns except the pairs as values that will not be pivoted.
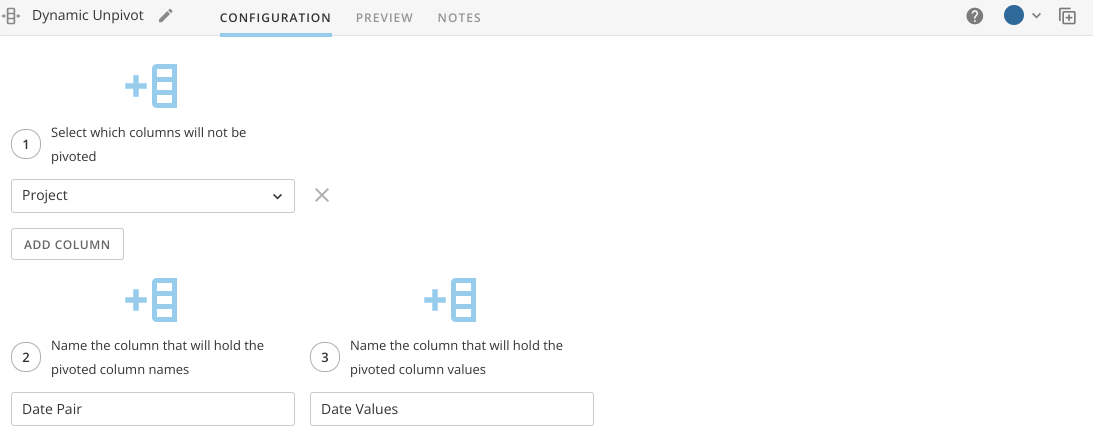
Then we split the columns again with the Split Columns to get separate value and we force them to be treated as Dates by setting up their type with Alter Columns


Optional: This approach will create one row for each date, so 9 rows per Project. You can apply a filter rows first to only keep the dates for which you have value pairs.
You'd build your card from this new dataset instead, and you'll only compare the number of times Actual Date is less than Initial Date.
Hope this helps,
Marcel Lüthi
Re: Average of a difference in Timestamps
Working with dates can be tricky, and while TIMEDIFF can work, I've found using UNIX_TIMESTAMP to work best.
UNIX_TIMESTAMP(Date1)-UNIX_TIMESTAMP(Date2)
This will give you the time difference in seconds, if you want it to be minutes you just divide by 60, for hours by 3600 (60*60) or 86400 (60*60*24) for days.
You might want to perform additional checks to see if a date is NULL or not, as NULLs will make the operation to return NULL which might not always be the desired outcome.