Best Of
Re: How to show user what columns they are sorted by?
Mega-Tables have arrows/numbers that show which columns are sorted:
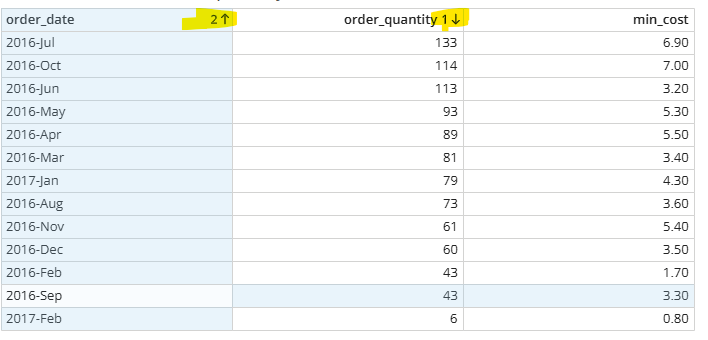
Are you talking about something in addition to that?

Duplicating a Dashboard into App Studio Breaks Cards & Re-adds Previously Removed Cards
I'm running into a consistent issue when importing a dashboard into a Domo App Studio app using the "Duplicate Cards" option during import.
Steps to reproduce:
- Go to an App Studio app → Pages and navigation → Order tab → Import > Dashboard
- Select an existing dashboard and check "Duplicate Cards"
- Complete the import
Issue 1 — Broken cards:
Some cards do not import correctly. They appear broken/non-functional in the app after duplication, even though they display fine on the original dashboard.
Issue 2 — Phantom/removed cards reappear:
Cards that were previously removed from the source dashboard (no longer present on it) still get pulled into the app during the duplicate-import process, as if Domo is referencing an old/cached version of the dashboard rather than its current state.
Workaround found:
When I import the same dashboard without duplicating (leaving "Duplicate Cards" unchecked, so the app links to the original cards instead of creating copies), the import works perfectly — no broken cards, no phantom cards.
Questions:
- Is this a known caching issue with the duplicate-on-import process specifically?
- Is there a recommended workaround for duplicating cards into an app while preserving reliability (e.g., "Save As" the dashboard first, clean it up, then import that instead)?
- Is this related to dashboards that have page filters/variables at the top? (I've seen a similar report from another user where duplication broke down specifically on dashboards with variables.)
Any guidance from Domo staff or others who've hit this would be appreciated.

Re: How many X did we do in Y?
You could try and leverage Domo's AI capabilities to allow users to ask their questions and get answers.

Re: How many X did we do in Y?
@Data_Devon have you looked at the AI chat feature + AI dictionary on core datasets? I believe they just made an update to AI chat last month that has significantly improved its responses and also allows it to use datasets that aren't in context.
 ellibot
Re: Datasets creation and adding the data
The public APIs are restricted to datasets created by the API; the API cannot upload data to non-API datasets.
Re: How to share App to non DOMO users?
Have you considered using the embed option? You could use the public embed option and share the URL with the people that need it.

Re: How to change the background on an expanded card in AppStudio?
TLDR;
1. A card's solid color background (from the card style) seems to default to the pop-up color for that card.
2. If your card's background color uses any level of transparency, then both your card's background color, and your app's background color seem to influence the pop-up background (blending the colors together).
3. When an app studio app uses a solid color for a background, then card pop-ups seem to use that color in addition to the card's transparent color.
4. When an app studio app uses an image for a background then card pop-up seem to use a dark grey color in addition to the card's transparent color.
@DWill978, sorry to dredge up an old forum, but if this is still bothering you I have encountered something very similar, and wanted to share my findings. In my exploration, I believe this is caused by using an image for your app studio background along with cards that have transparent backgrounds.
When your app studio page is set to have a solid background color, the expanded card pop-up background will match that. Here the app has its background color set to green, and when viewing this text card in the pop-up we see that is green as well.

However, if an image is used as the background, the color is automatically chosen. Here I use an image with greys, whites, and greens for the app background, and my card's pop-up background is grey:

At first, I thought this was the result of some calculation from the colors in the image (blending everything together? Taking the most frequent color?). But, on further testing, I believe a default grey is always applied, and no image processing logic is being performed. Even using an image of a solid color for the background, I still end up with the same grey background:

When transparency is involved, the card pop-up inherits a background color as a combination of the card background color, and the app background color, and an image for a background is treated as the color grey.
Here are some more test cases:
A card with a 100% transparent background on an app with a solid color background:

The pop-up view has the app's background:

A card with a 100% transparent background on an app with an image background:

The pop-up view has this dark grey background:

A card with a 50% transparent red background on a teal solid color app background:

Opens in the pop-up with the same blended muddy purple background we see in app:

And finally, a 50% transparent red card background in an app with an image for a background:

Opens in the pop-up view in this dark red, presumably from overlaying the 50% red on top of the dark grey default from the image:


Card Limitations
It has been 49 business days since @DavidChurchman posted what I consider the most significant forum discussion of 2026. And since then, I don't think a day has gone by where I don't realize I am limited by Domo cards.
The chart below is a mock-up. The numbers in the image are fake.
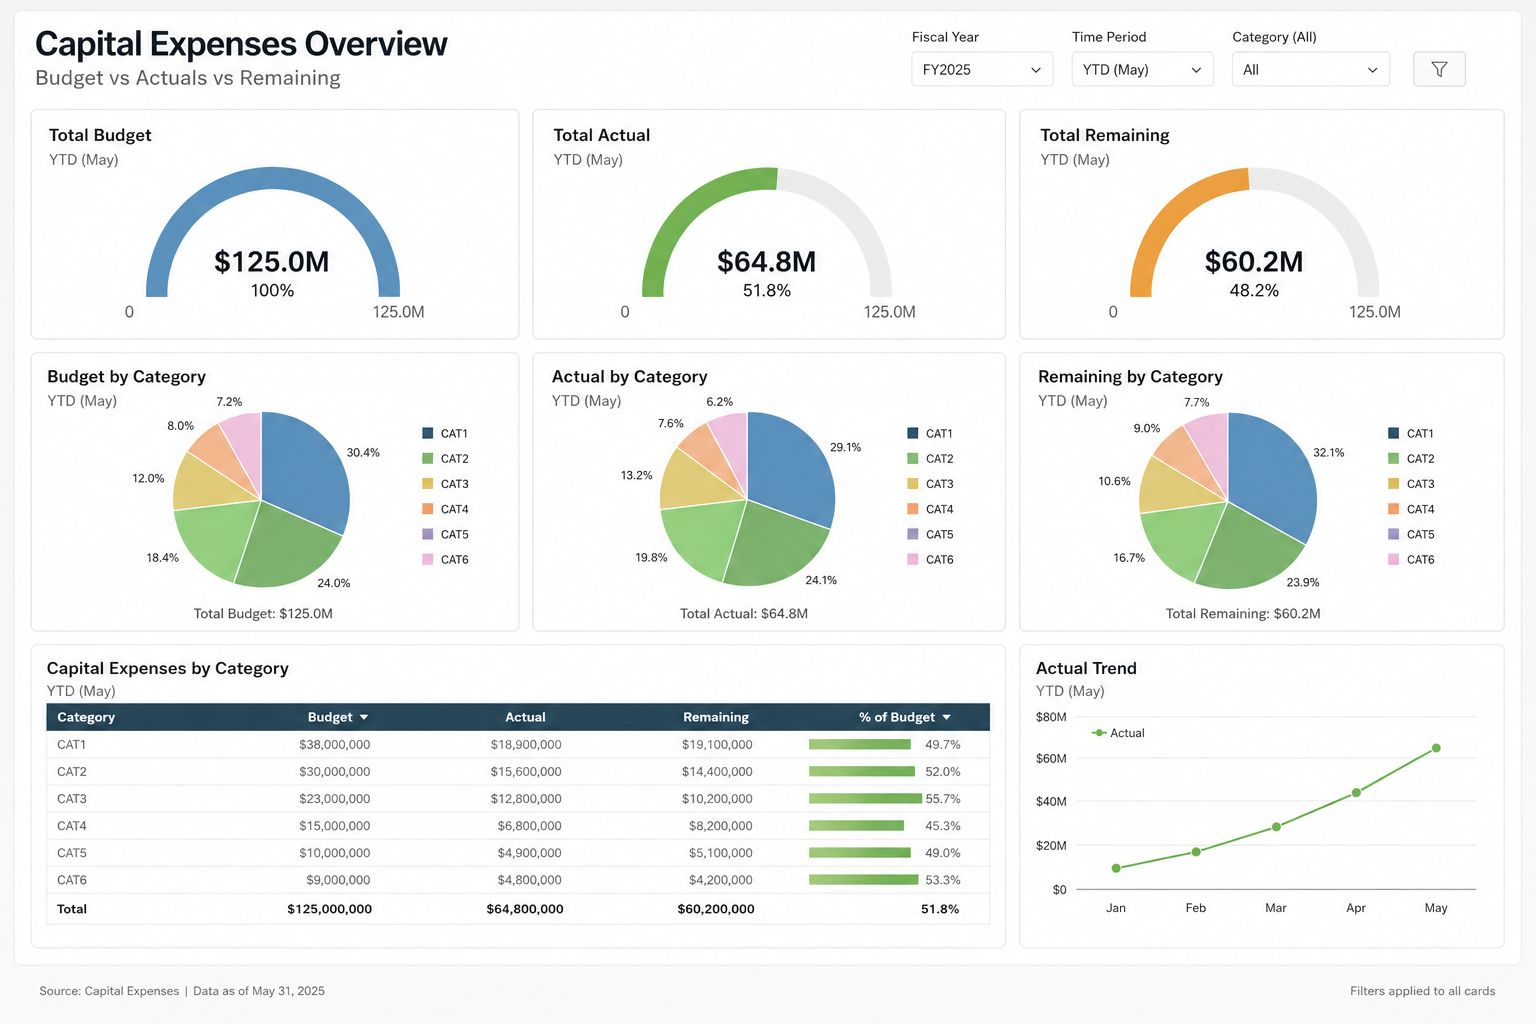
Challenge - can you replicate this with Domo cards - no blank bricks, no AI, as shown?
- Gauges are half circle, start at zero.
- Each gauge has a currency amount and a percent beneath it.
- Every slice (in the pie charts) show a label - even small slices
- Each pie chart has a total at the bottom and a legend on the side.
- Table chart has a horizontal bar on last column.
- Simply line chart with node (dot) at each reference point
Sample data would be something like
Fiscal Year | Category | Measure Type | Amount |
|---|---|---|---|
FY2025 | CAT1 | Budget | 35000000 |
FY2025 | CAT2 | Budget | 28000000 |
FY2025 | CAT3 | Budget | 24000000 |
FY2025 | CAT4 | Budget | 18000000 |
FY2025 | CAT5 | Budget | 15000000 |
FY2025 | CAT6 | Budget | 5000000 |
FY2025 | CAT1 | Actual | 12000000 |
FY2025 | CAT2 | Actual | 8000000 |
FY2025 | CAT3 | Actual | 24000000 |
FY2025 | CAT4 | Actual | 15000000 |
FY2025 | CAT5 | Actual | 3500000 |
FY2025 | CAT6 | Actual | 2300000 |
FY2025 | CAT1 | Remaining | 23000000 |
FY2025 | CAT2 | Remaining | 20000000 |
FY2025 | CAT3 | Remaining | 0 |
FY2025 | CAT4 | Remaining | 3000000 |
FY2025 | CAT5 | Remaining | 11500000 |
FY2025 | CAT6 | Remaining | 2700000 |

Re: Card Limitations
Yes @Landon W., the line chart was achievable. And your progress bar is a very creative approach. Nice job on that. I appreciate the effort that went into the attempt.
This isn't really about a progress bar—it's about perception. Every visual element communicates something to the audience. An ASCII-style progress bar immediately makes the product feel dated, regardless of how powerful the backend is.
If we're competing for an enterprise customer, and your team shows ASCII bars while I show the dashboard mock-up above, the buying decision may already be made before anyone starts discussing features. Enterprise customers don't just evaluate capabilities—they evaluate polish, usability, and the confidence the product inspires.
Re: Visualization options to show Actual vs. Budget and Variance on the same chart?
I don't think there's any way of getting that exact graph using standard cards, but you could get similar analysis.
Assuming your data looks something like this:

I would say the closest thing to an "out-of-the-box" card for this use case would be the variance line chart:

With a little more work, you could get pretty close with a symbol+bar graph (2 symbols/sync lines)


