Best Of
Re: HTML code is not working in table view
odd. I just did a test and it worked.
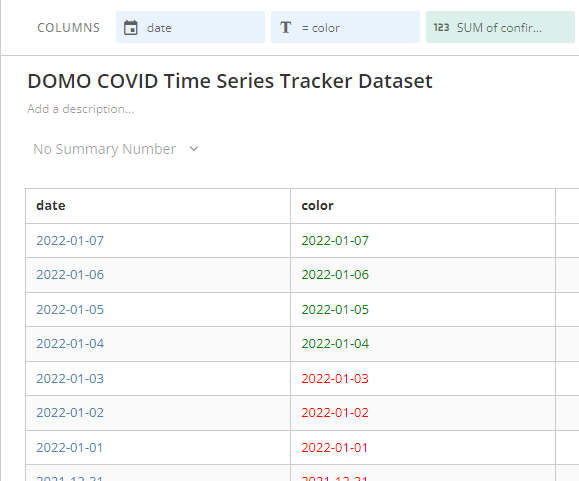
My beast mode looks like this which is just a copy and paste of what you shared but changed the date field to match the covid dataset field.
CASE WHEN DATEDIFF(CURRENT_DATE(), `date`) > 3 then concat('<div style="color:red">',`date`, '</div>')

ELSE concat('<div style="color:green">', `date`, '</div>')

END
Do you have any other properties set? Something in the chart properties could be overriding it.

Re: Really 12 hours?
If I recall, the exam is a two-part exam. One part is a multiple choice exam that is around 20 questions. You do have to complete it once you start it, but only takes about 30 minutes and they give you a big window to complete. The 2nd part is an "offline exercise" that you will complete and upload your finished product by either producing screenshots or a screen recording. They estimate that the two parts could take up to 12 hours of work, but you are not under a timer for the 2nd part.
Hope this helps.
Re: Slicer Select All Feature
@daniel_cruz_2016 the Slicer card General Properties has a Hide Header option which determines whether the 'Select all (#)' and 'Show selected' headers are displayed.
Re: Could not refresh dataset - Other Provider
Thank you Mark it was indeed Workbench that stopped working.
 FXM32
Re: Could not refresh dataset - Other Provider
This is likely coming from Domo Workbench. You need to go to where Domo Workbench is installed (likely on a company server) and check there for the reason that it isn't running. In Workbench, you can also change the type from Other Provider to Excel.
Re: How to append monthly data?
the dataset via e-mail connector does have an update mode of append, but it can be challenging if you are toggling back and forth and not lose what is currently stored.
I might suggest a recursive dataflow. Here is the KB article on how to create it in Magic ETL.
Re: How to append monthly data?
Hi @eriena
You'll want to utilize a recursive dataflow. The knowledge base has several different articles on how to do this. Here's the Magic ETL version:

Re: Issue with dates in ETL
@r4geqwit I actually was able to recreate your issue in Magic ETL. This does seem like a bug that should reported to Domo Support. However, I was able to develop a workaround by wrapping a date function around both values and then it evaluated correctly. Like this:
CASE WHEN DATE(`datereported`) >= DATE('1/1/2022') THEN 'Y' ELSE 'N' END
I would suggest doing something like this your ETL as a temporary fix, but also letting support know of the bug.
Re: Data Overview
Hi @Stefan
Domo provides some metadata specifically with this information. If you use the Domo Governance DataSets connector you can pull in the "Dataset Schema" dataset which will list all of the datasets and columns in each dataset.
Re: Need help to show total of last 18 months for each month for last 12 months
If your dataset is showing totals for each day, you can do this in Magic ETL with just a few tiles. It would look something like this:

Use the formula tile to create a year column and month column

Use the group by tile to get totals for each month:

Use the Rank & Window tile create an 18-month total calculation by using the SUM and 18 preceding and sorting by year and month


This should get you what you want.