Best Of
Re: Does anyone know how to convert Google Analytics "Date Hour and Minute"?
You can use a formula tile to splice out the different parts and assemble it as a timestamp:
TIMESTAMP(CONCAT (
  LEFT(`Date Hour and Minute`, 4), '-',
  SUBSTRING(`Date Hour and Minute`, 5, 2), '-',
  SUBSTRING(`Date Hour and Minute`, 7, 2), ' ',
  SUBSTRING(`Date Hour and Minute`, 9, 2), ':',
  SUBSTRING(`Date Hour and Minute`, 1, 2)))

Re: Creating an "unassigned" row for gantt chart visualization
@MarkSnodgrass thank you!! This was really helpful (and much simpler than what I was thinking) - I was able to take this and run with this to get what I need.
Writing up the full solution for anyone who runs into something similar:
I anonymized a subset of the data and ended up finding some edge cases I hadn't considered - 1) resources with no assignment and 2) unassigned days before the first assignment for the resource and after the last assignment for a resource and 3) overlapping resource assignments i.e. Assignment A and B have the same start date but different end dates:

I applied the logic you gave me (and added a sort on end date in the rank and window to handle overlapping assignments like curly's that both start 10/13) which filled in all the gaps:

I was then able to extend the logic to handle these red bars:
The case where nobody is assigned is a simple formula for start date is null and end date is null.
For the days before the first start date:
- Rank and window tile - create a column last_start_date that is the lag of start date, ordered on start and end date
- Formula tile:

For the days after the last end date:
- Rank and window tile - create a column next_end_date that is the lead of start date, ordered on start and end date
- Formula tile:

Then append all of these to the original dataset and boom, magic.
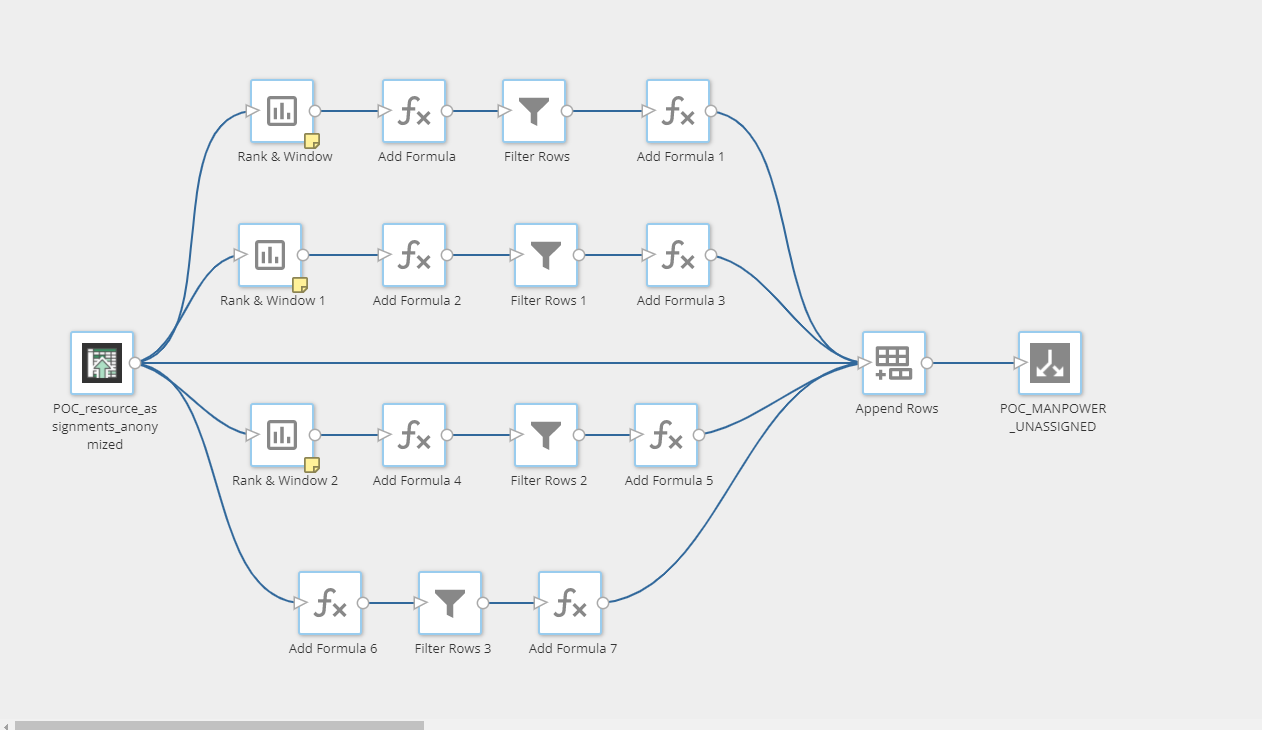

Now I just have to switch in the real dataset to this logic :)
 mhouston
Re: Creating an "unassigned" row for gantt chart visualization
I would suggest keeping your data in your original format and then building out your unassigned dates by using the rank and window tile and a formula tile. I did it by doing the following:
- Connect your original dataset to a rank and window tile and then create a column called Last End Date and choose the Lag function using the End Date column with an offset of 1. Order by the start ascending and partition on the resource name
- Add a formula tile next and create 3 columns that look like this

This will result in an output like this:

You can then filter to unassigned equal 1 and overwrite your assignment name column to unassigned and then append to your original dataset using the unassigned start and end dates as your start and end dates.
Hope that makes sense.

Re: Framed Sum in Rank & Window Magic ETL not treating zeroes properly
Using your screen shots I built a webform and tested this out and I got the same results. I added in an "Alter Columns" tile and CAST the "Total Revenue" column to be a Fixed Decimal and after that the Rank & Window returned 0.0 on the rows I expected to be 0.
I can't remember exactly why this happens but it is something to do with binary and scientific notation not playing well together.


Re: Framed Sum in Rank & Window Magic ETL not treating zeroes properly
@TheLookout Tried it out and it worked perfectly! Thanks so much for your help :)
Magic ETL - copy/paste JSON definition to clipboard
During the Technical User Group kickoff call, @john_stevens dropped some knowledge on us that just blew my mind. As seen in the gif below, you can copy Magic ETL tiles to the clipboard, and then paste into a text editor and it will give you the JSON definition of those tiles. That definition file can then be edited and repasted into the Magic canvas to produce new tiles. This can be incredibly helpful if you're wanting to edit Magic in bulk and don't want to use the Java CLI. I'm really excited to try this out more!

-Elliott 😁
Formatting Multiple Summary Numbers with Commas
Problem
To build summary numbers with multiple metrics, one needs to use the CONCAT operator, which converts the entire output to a string. This means that numbers won’t contain comma’s. In this case, a solution is needed to dynamically add comma’s to these numbers based on their length.
For example, in the Summary Number below the first number has no commas. The second number being a percentage is easier to handle because it is rounded to one decimal precision and never needs a comma because it never exceeds the hundreds.

Desired output:

Solution
- Find the Length of the Number
- Break it into appropriate comma blocks
- Concatenate commas between the blocks.
For example, a four-digit number is in the thousands and would have two sections: the first number followed by a comma and then the last three numbers: [1],[234]
This can be handling using a combination of LENGTH() to get the overall length of the number, ROUND() to remove decimal precision and SUBSTRING() to pick out the position of the characters you want to place in each comma block. In addition, it will need to be handled using nested CASE logic to identify each case and handle it appropriately. Lastly, it will be tied together with another CONCAT().
Code
Here is a sample of code that demonstrates how to format one metric up to hundreds of millions - 9 digits in length. Since you will have multiple summary numbers, you would need to do this for each numeric value in the summary number.
CASE
 WHEN LENGTH(ROUND(SUM(`Measure Column`))) = 9 -- 9 digits = hundreds of millions
 THEN
   CONCAT(
   SUBSTRING(ROUND(SUM(`Measure Column`)),1,3), -- first comma block
   ',',
   SUBSTRING(ROUND(SUM(`Measure Column`)), 3,3), -- second comma block
   ',',
   SUBSTRING(ROUND(SUM(`Measure Column`)),6,3) -- third comma block
   )
 WHEN LENGTH(ROUND(SUM(`Measure Column`))) = 8 -- 8 digits = tens of millions
 THEN
   CONCAT(
   SUBSTRING(ROUND(SUM(`Measure Column`)),1,3), -- first comma block
   ',',
   SUBSTRING(ROUND(SUM(`Measure Column`)), 2,3), -- second comma block
   ',',
   SUBSTRING(ROUND(SUM(`Measure Column`)),6,3) -- third comma block
   )
 WHEN LENGTH(ROUND(SUM(`Measure Column`))) = 7 -- 7 digits = millions
 THEN
   CONCAT(
   SUBSTRING(ROUND(SUM(`Measure Column`)),1,1), -- first comma block
   ',',
   SUBSTRING(ROUND(SUM(`Measure Column`)), 2,3), -- second comma block
   ',',
   SUBSTRING(ROUND(SUM(`Measure Column`)),5,3) -- third comma block
   )
 WHEN LENGTH(ROUND(SUM(`Measure Column`))) = 6 -- 6 digits = hundreds of thousands
 THEN
   CONCAT(
   SUBSTRING(ROUND(SUM(`Measure Column`)),1,3), -- first comma block
   ',',
   SUBSTRING(ROUND(SUM(`Measure Column`)), 4,3) -- second comma block
   )
 WHEN LENGTH(ROUND(SUM(`Measure Column`))) = 5 -- 5 digits = tens of thousands
 THEN
   CONCAT(
   SUBSTRING(ROUND(SUM(`Measure Column`)),1,2), -- first comma block
   ',',
   SUBSTRING(ROUND(SUM(`Measure Column`)), 3,3) -- second comma block
   )
 WHEN LENGTH(ROUND(SUM(`Measure Column`))) = 4 -- 4 digits = thousands
 THEN
   CONCAT(
   SUBSTRING(ROUND(SUM(`Measure Column`)),1,1), -- first comma block
   ',',
   SUBSTRING(ROUND(SUM(`Measure Column`)), 2,3) -- second comma block
   )
 WHEN LENGTH(ROUND(SUM(`Measure Column`))) < 4 -- < 4 digits = hundreds or less
 THEN ROUND(SUM(`Measure Column`))
END

I Solved it with Domo Competition Details
Calling all community members, we want your insights to share on Domo.com's community blog. This competition is simple -- submit a technical solution and you could be one of our top entries highlighted and awarded at Domopalooza. This will provide great value to the Domo community as you participate.
Submission details:
What: Submit a short (150-500 words) description of a Domo solution that's helped you in your technical role. Please include the following:
- A Problem Statement: What task were you troubleshooting in Domo that kept coming up or was causing you headaches?
- A Solution Statement: What did you discover in Domo that allowed you to do this?
- Demo: Briefly describe (in words) OR include a short clip showing how you accomplished it
- Hero Image (Optional/If Applicable): Include a design (600x400px) that showcases your solution.
- If you need assistance in creating an image, please reach out to isolveditindomo@domo.com
When: Submit your article by February 28th. Early submissions welcome. Start thinking about your solution as soon as possible.
Where: Submit your articles via email to isolveditindomo@domo.com.
Why: Top articles will be posted on Domo.com's new Community Blog! By submitting to this competition, you're creating valuable content to help your fellow Domo community to be reviewed for years to come.
We appreciate you in advance for participating in the #ISolvedItWithDomo 2022 competition. We can't wait to highlight and award winners at Domopalooza in just a couple months.
Let's get creating!
Comment below if you have any further questions 👇🏼

Re: Buzz Installer Options when using Microsoft Intune
Hi @jstan, there's an option to link Buzz to an external platform, which is documented here: https://developer.domo.com/docs/api-reference/buzz-integration-api-reference.
I believe you'll need to first ask Support [support.domo.com] to activate the API for your instance as it is disabled by default. After they have turned it on, you can follow the steps in the doc.
 amehdad
Re: GA Advanced Connector and Domo (Demographics)
So my point was on the settings in your Google Analytics instance as there's likely different permissions to tick/enable in the admin page.
Also confirming that, on Domo, you aren't getting an error message?
amehdad