Best Of
Re: CourseBuilder - MacOS - Cannot be opened
You can also try and right click on the application and select open to possibly bypass the message or opt down option and double click it to allow for you to open it

Re: Filtering a dashboard across multiple datasets
I think I had the same problem as you a while ago. When you click on Add Filter, click on the arrow to the right of the column you are wanting to filter on. Then click on Select All. Here are some screenshots to help you.


This should make your filter apply to all the datasets on the card.
Hope this helps.

Re: Split string column into multiple rows
You will need to set up a Magic ETL like this :
1) load your data into a Magic ETL

2) Split your Note column into multiple notes, In my example I use only 3 using the following configuration
use a costum delimiter [\r\n] use regex

3) now you can unpivot to generate rows for each row by ItemID

4) the last step is just to drop the original column that contains the raw notes if you want to
 Godiepi
Become a Domo Sensei
We're so excited to introduce a new program to Domo's technical community members! This program was built to reward and recognize those who invest so much into the Domo platform.
Our masters of the Domo platform, will now be known as Sensei's, and create valuable content for all users to benefit. Therefore, Domo wants to invest back into you through the Sensei Program.
Sensei: A title of honor for someone who is a master of their craft and teach others their specialty
How do I become a Sensei?
· Complete the highest level of technical certification (MajorDomo)
· Hit super user status on the Dojo (Blue belt or above)
How do I keep status?
· Write two community blogs per year
· Speak at one event per year
· Help one person get certified
What perks do I get?
· Initiation to the annual Sensei fall retreat
· Exclusive swag
· Credly badges
· Free certification gift
What value do I get?
· Career growth
· Industry recognition
· Community status
· Networking
We're excited to grow a team of Domo Sensei's. Let us know if you have any further questions about this program in the comments below.

Re: Beast mode to extract the date based on a pattern
Is your date always in the format of MM/DD/YY? The following regular expression will handle MM/DD/YY and MM/DD/YYYY formats.
I'd recommend doing this in a Magic ETL as it'll reduce the processing needed when displaying your data and not have to calculate it every time you load your cards. You can use a formula tile and a regular expression to extract the date out of your string. You can then compare the extracted version to the original version - if they're the same the regex failed and then you can use the orddate:
extracted_date
REGEXP_REPLACE(`description`, '^.*(\d{1,2}\/\d{1,2}\/(\d{2})|(\d{4})).*$', '$1')
date
IF `extracted_date` = `description` THEN `orddate` ELSE `extracted_date` END
Re: Beast mode to extract the date based on a pattern
Try this to deal with the additional scenarios
DATE(
 CASE WHEN LEFT(`description`,5) = '*SLD ' THEN
	IFNULL(TRY_CAST(SPLIT_PART(`description`,' ',2) AS DATE),`orddate`)
 WHEN LEFT(`description`,4) = '*SLD' THEN
 	IFNULL(TRY_CAST(SPLIT_PART(REPLACE(`description`,'*SLD',''),' ',1) AS DATE),`orddate`)
 ELSE
 	`orddate`
 END)
Re: Can someone give me DDX Bricks examples which use traditional SQL (using JOIN) to query?
Have you looked at the "DDX SQL Input Bar Chart Output" DDX brick in the app store? You'd need to specify the different datasets in your DDX brick but you should then be able to utilize your join.
Re: Using Python API to Update Already Created Datasets
@ElliotGitter where is your dataset coming from? Is it updating from somewhere else too?
Once you've created the dataset using the API, you can always update it using the API (it's not like everytime you run your python script you have to create a new dataset to update). If you can create a new dataset using the API, update it once with the data in yourcurrent dataset, then moving forward you can update that dataset you created with your python script.
 mhouston
Re: Scatter Chart Bubble Color
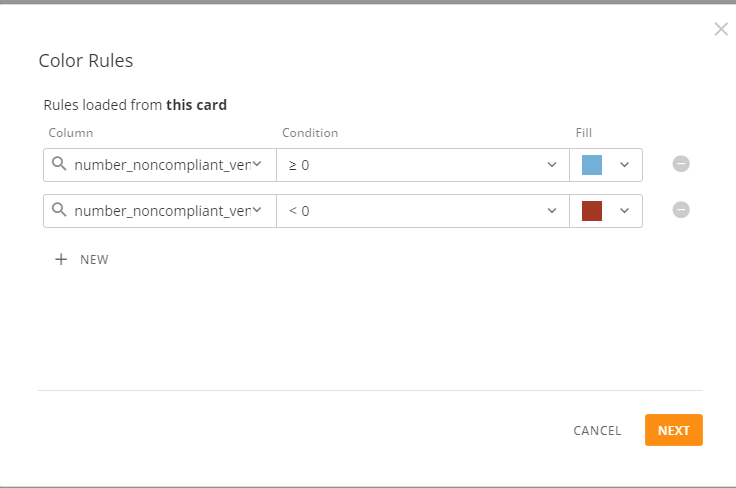
In the chart properties you can set the color rules. So depending on your dataset, you can set a color rule when that field is 0 to green and less than 0 to red.
 mhouston
Re: Replace text and value mapper failing
I would suggest moving away from the replace text and value mapper tiles and use the formula tile in your ETL. It is much more flexible and you can do all your work in a single tile.
You can do something like this in the formula tile.
CAST(
CASE WHEN `field` = '#DIV/O' THEN 0
WHEN `field` = '--' THEN 0
ELSE `field`
END as INTEGER)
You can add additional WHEN statements for other variations that your data might have. You might also want to use the TRIM function around your field in case there are spaces.
Another option is this where it tests to see if it can convert it to an integer and using the number if it can, otherwise it will make it a zero.
CAST(
CASE WHEN TRY_CAST(`field` as INTEGER) > 0 THEN `field`
ELSE 0
END as INTEGER)
You could use NULL instead of 0 in your ELSE statement if that is more appropriate.
Hope this helps.