Best Of
Re: UK map in DOMO
Here are 2 ideas that address this topic.
Please be sure to vote them up by clicking on the white arrow next to the idea title. Once it receives a vote our product team will assign a product manager to review.
Thanks!
Re: How to show different values in same card?
Hi @travorhouse ,
For example if the dataset is like this:

and card has to be built showing following:
-Users with no pics
-users with no department
-users with no title
-users with no ORG connection
then how di i show everything in one card?
Re: Domo should give an option to manage abbrevation of Billions, Millions,,K
You might know about this already but in several visualizations there's a 'scale abbreviation' option that does what you're describing. It's not always available for all numbers in all visuals all the time, but it might help you in a pinch.

 G_Grey
Re: Applying a color rules conditionally based values in columns.
So, when are we going to get this?
 snguyen
Re: MAGIC ETL Formula
@aldwinB Instead of `Product Group name`='%AB%', use `Product Group name` LIKE '%AB%'. The LIKE operator allows you to search for patterns in a string using wildcards, while the equals sign matches the exact string in quotes (in this case %AB%)

Dynamic goal line help
I've been exploring Domo's goal line support today and have some questions:
- Is there an article or something on how to easily and reliably set dynamic goal lines?
- Is there a list of chart types that support custom goal lines through the "general" chart settings dialog?
- Is there a list of chart types that have goal lines build-in, like Bullet Graphs?
Those are the questions I've come up with, below is more detail about what I'm doing, what I've tried, and what I'm trying to accomplish.
I Like Goal Lines. A lot.
First off, I like the general idea - comparing these two small-scale charts shows why:
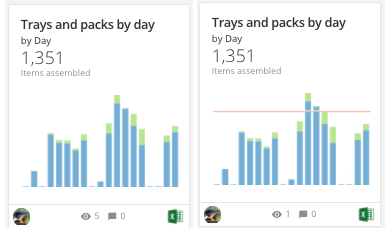
It's the same data and the same chart, but the goal line makes it easy to answer a question at a glance: How are we doing? The answer is right there and it's legible at a small scale. So, I'm all in on goal lines.
Card Goal Lines are Static, We Need Dynamic Goal Lines
By default, goal lines are a property of a card, either set in the goal field for the y-axis and/or in the chart's general properties. We need dynamic goal lines. Even if the value is the same across all dates/data for a card, we'll be reusing cards with PDP and over time. Either way, goals will change between months, years, and groups. So, we need goal lines to come from the data not the card.
Befuddled
I've been trying to sort out how to do this and am a bit befuddled. I can see that there are a lot of similar questions going back years. For example:
Goal adjusts when filter applied
How do I create a Beast Mode to represent a static number(goal) for each month?
Running Total Stacked Bar + Line chart type
I've reviewed these (and other questions) and did manage to build a custom goal line:

(I just dummied up a calculated field to plot, it's not real data.) Now I run into my problems. My original chart is a Stacked Bar with a pretty simple configuration: a count on a field and a series to split out the blue and green bars:

That's it, very easy. But a Stacked Bar chart doesn't support the chart options for a data-driven goal line. So, I've shifted to a Stacked Bar + Line. It doesn't plot the same way at all.
- The goal line has to be set as the y-axis. Why?
- Unlike the Stacked Bar, I have to use a Beast Mode to split my count values by my series values. If this is true, it makes this approach a non-starter in many cases. We can't always anticipate all of the 'break' conditions. In my simple test case, there are only two possible values in the break series, so it works.
At least with a Beast Mode column, the Analyzer spits the dummy a lot. I ended up with this error freq uently:
Setting the y-axis aggregation to AVG seemed to fix the problem, but I don't think that was the real problem. I think it was just chance that it worked when I happened to select that option.
Goal-oriented Chart Types
The other week I stumbled across Domo's Bullet Graph, which has Goal as a first-order chart element. It's a helpful chart type. Are there other chart types that are designed to show progress towards a goal, other than gauges and other single-value charts?
Thank you.
Re: Colour condition for words in a string
You could utilize an HTML table and utilize HTML code to colorize each value in your string. You'd need to CONCAT the HTML code together with your values and conditionally set the color. I've done a previous writeup on this here: https://dojo.domo.com/main/discussion/52684/domo-ideas-conference-beast-modes-conditional-formatting#latest

Re: Re-order page filters
This is really needed. Alphabetical at a minimum is something that I could work with. I prefer the way page filtering works on the Domo app. IMO, filter cards are not easy to work with on the app.