I'm stuck. Sum of a Windowed/Partitioned Sum???
Options

chapman
Member
in Beast Mode
I keep running into a wall with this. I think there is an easy answer, I just can't find it for the life of me.
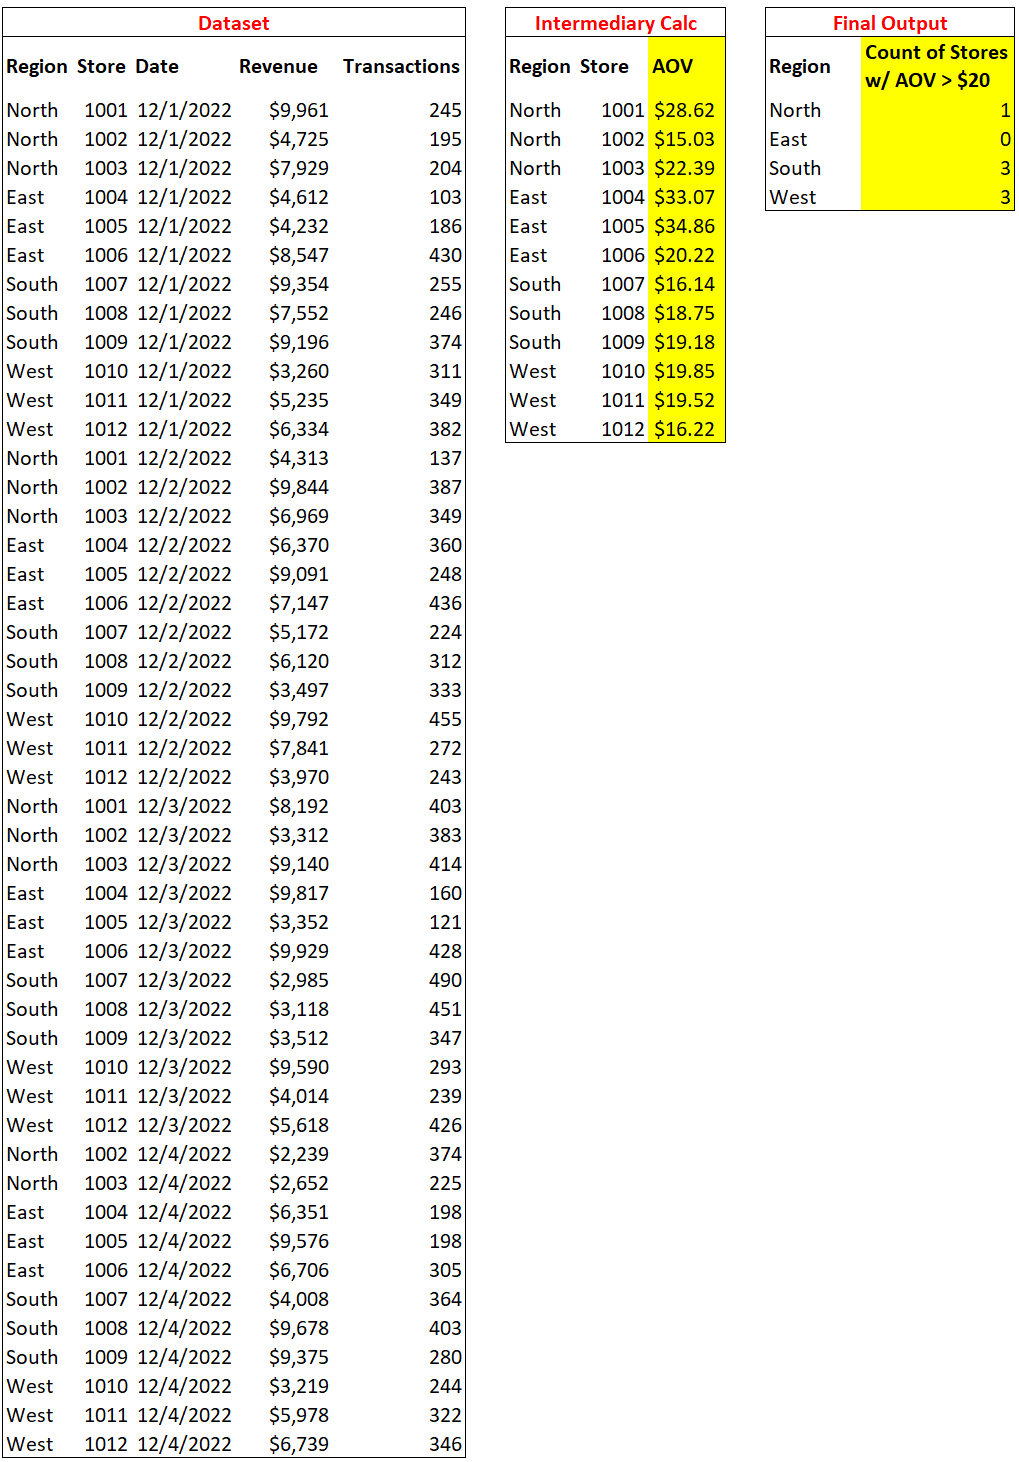
- My dataset contains one row per store, per day.
- I want to display -- by region -- the count of stores with an average order value (AOV) less than $20.
- In order to do that, I first need to calculate AOV by store for the period.
I'm having trouble understanding why this won't work:
SUM(
CASE WHEN (SUM(`Revenue`) / SUM(`Transactions`)) < 20 THEN 1 ELSE 0 END
) OVER (PARTITION BY `Store`)
I have also tried multiple iterations of this, to no avail:
COUNT(
CASE WHEN
SUM(SUM(`Revenue`) FIXED (BY `Store)) / SUM(SUM(`Transactions`) FIXED (BY `Store`))
< 20 THEN 1 END
) OVER (PARTITION BY `Region`)
Here is a mockup in Excel, with yellow to represent beast modes.
Tagged:
0
Answers
-
Hi @chapman
So I think you're close, but just need to move some things around. I made a video for you to show you how:
https://www.loom.com/share/295fd98f101c4ef0b5a6a7e6ddce4363
Good luck,
John Le
You're only one dashboard away.
More video solutions at: https://www.dashboarddudes.com/pantry

John Le
You're only one dashboard away.
Click here for more video solutions:
1

Categories
- All Categories
- 1.5K Product Ideas
- 1.5K Ideas Exchange
- 1.4K Connect
- 1.1K Connectors
- 278 Workbench
- 4 Cloud Amplifier
- 4 Federated
- 2.7K Transform
- 89 SQL DataFlows
- 561 Datasets
- 2K Magic ETL
- 3.4K Visualize
- 2.3K Charting
- 581 Beast Mode
- 13 App Studio
- 28 Variables
- 584 Automate
- 142 Apps
- 415 APIs & Domo Developer
- 26 Workflows
- 1 DomoAI
- 28 Predict
- 12 Jupyter Workspaces
- 16 R & Python Tiles
- 357 Distribute
- 96 Domo Everywhere
- 259 Scheduled Reports
- 2 Software Integrations
- 93 Manage
- 90 Governance & Security
- 9 Product Release Questions
- Community Forums
- 37 Getting Started
- 28 Community Member Introductions
- 89 Community Announcements
- 4.8K Archive