Multiple measures in one card?

Hi All,
Is there an option for inputting multiple fields into the Pie Name?
My data is structured like this example:
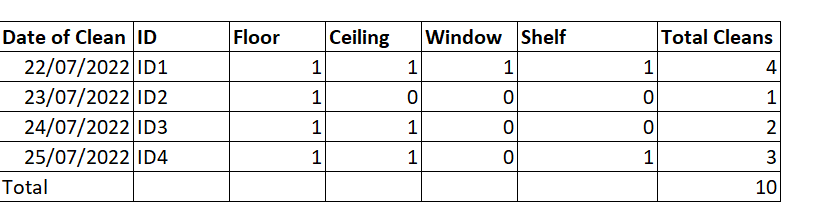
I would like to:
1) Show the % breakdown of Total Cleans by Clean Type on a Pie/Donut Chart (% examples seen below the table)

The Pie name option offers one input:
Answers
-
Hi @NateBI
You'll want to use a Magic ETL and Unpivot your data such that you have a column for the different types of clean and then use that column in your Pie Chart. The pie chart only supports a single value for the pie name.
**Was this post helpful? Click Agree or Like below**
**Did this solve your problem? Accept it as a solution!**2 -
Hi @GrantSmith, I want to avoid unpivoting the dataset in this scenario for various reasons but thank you. I found a work-around here:
Update: To achieve a similar result I dragged the Clean Type columns onto a bar chart. I used one of the Clean Type columns as the X-Axis and hid the X-Axis label, then included the Percentage in the data label settings. The card will auto SUM the columns so it works or you can use a SUM() BM for each column.
Caveats: If you add more value fields it will impact the percentage figures.
1

Categories
- All Categories
- Product Ideas
- 2.1K Ideas Exchange
- Connect
- 1.3K Connectors
- 309 Workbench
- 7 Cloud Amplifier
- 10 Federated
- Transform
- 664 Datasets
- 120 SQL DataFlows
- 2.3K Magic ETL
- 825 Beast Mode
- Visualize
- 2.6K Charting
- 88 App Studio
- 46 Variables
- Automate
- 195 Apps
- 486 APIs & Domo Developer
- 94 Workflows
- 24 Code Engine
- AI and Machine Learning
- 23 AI Chat
- 4 AI Projects and Models
- 18 Jupyter Workspaces
- Distribute
- 119 Domo Everywhere
- 283 Scheduled Reports
- 11 Software Integrations
- Manage
- 143 Governance & Security
- 11 Domo Community Gallery
- 49 Product Releases
- 13 Domo University
- Community Forums
- 41 Getting Started
- 31 Community Member Introductions
- 116 Community Announcements
- 5K Archive