Best Of
Add SmartText to data label
I have implemented a page filter for users to toggle between currency expressions of revenue and it would be useful to enable table column names to either display the currency symbol selected or (probably a lighter lift) enable SmartText in the column names ("data labels").
 SlickVic
Campaign App Dataset Usage
Campaigns in the app started failing because some datasets could not be accessed.
Datasets were showing the message "This Dataset has not been accessed in a while…"
While clicking the Start button resolved the issue, I would ask that the Campaign App be updated so that it flags the dataset as accessed.
Sometimes the only purpose of a dataset is a campaign, and currently the dataset will show as unused. Therefore I would also request that the Campaign App show up under the Impact section when deleting a dataset, or perhaps under the Linage section of a dataset to show that it is being used.
Column width control on transposed tables
Would be nice to be able to control column width (General -> Column Width) for transposed tables.


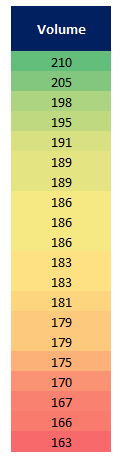
Red to Green Heat Map
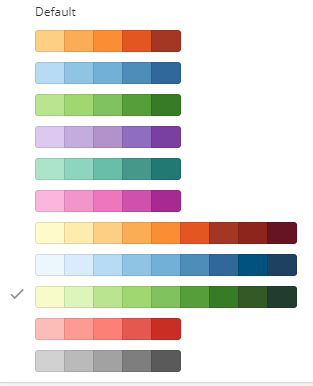
The red to green heat map is the gold standard of color formatting in the business world. The current single color pallets are....not good.
It would be great to have this option as a default for any column in any kind of table.
Thank you for your consideration!

Re: show percent on period over period graph
Hi @user082291
It's not quite possible to use a period over period chart when you're wanting to plot two different period intervals (quarter and year).
I'm not a real fan of the period over period charts and prefer to do my own as I have more flexibility over the data than I do the chart.
What you can do is create a date dimension table which calculates the dates for this year, last year, last quarter etc. I utilized a MySQL dataflow to calculate these from the calendar dates Domo Dimension dataset.
select d.`dt` as "Report Date", date_sub(`dt`, interval '0' year) as "Comparison Date", 'Current' as 'Period Type'
from `calendar_dates` d

UNION

select d.`dt` as "Report Date", date_sub(`dt`, interval '7' day) as "Comparison Date", 'Last Week' as 'Period Type'
from `calendar_dates` d

UNION

select d.`dt` as "Report Date", date_sub(`dt`, interval '1' month) as "Comparison Date", 'Last Month' as 'Period Type'
from `calendar_dates` d

UNION

select d.`dt` as "Report Date", date_sub(`dt`, interval '28' day) as "Comparison Date", '28 Days Ago' as 'Period Type'
from `calendar_dates` d

UNION

select d.`dt` as "Report Date", date_sub(`dt`, interval '364' day) as "Comparison Date", 'Last Year (DOW Aligned)' as 'Period Type'
from `calendar_dates` d

UNION

select d.`dt` as "Report Date", date_sub(`dt`, interval '1' year) as "Comparison Date", 'Last Year' as 'Period Type'
from `calendar_dates` d

UNION

select d.`dt` as "Report Date", date_sub(`dt`, interval '2' year) as "Comparison Date", '2 Years Ago' as 'Period Type'
from `calendar_dates` d

UNION

select d.`dt` as "Report Date", date_sub(`dt`, interval '728' day) as "Comparison Date", '2 Years Ago (DOW Aligned)' as 'Period Type'
from `calendar_dates` d

UNION

select d.`dt` as "Report Date", date_sub(`dt`, interval '3' year) as "Comparison Date", '3 Years Ago' as 'Period Type'
from `calendar_dates` d

UNION

select d.`dt` as "Report Date", date_sub(`dt`, interval '1,092' day) as "Comparison Date", '3 Years Ago (DOW Aligned)' as 'Period Type'
from `calendar_dates` d

UNION

select d.`dt` as "Report Date", date_sub(`dt`, interval '1' quarter) as "Comparison Date", 'Last Quarter' as 'Period Type'
from `calendar_dates` d
(feel free to take out scenarios you won't need to reduce the data size of the resulting dataset)
Using this dataset I'll then utilize a Fusion to join my data set date to this date dimension's Comparison Date (this is important).
Once I have that Fusion dataset created I can then use that within a card (bar chart in your case) and utilize some beast modes to calculate the numbers like:
Last Quarter:
CASE
   WHEN SUM(CASE WHEN `Period Type` = 'Last Quarter' THEN 1 ELSE 0 END) = 0 THEN
   0
ELSE
   SUM(CASE WHEN `Period Type` = 'Last Quarter' AND `Anonymous`='Y' THEN
         1
       ELSE
         0
       END)
    /
    SUM(CASE WHEN `Period Type` = 'Last Quarter' THEN
          1
        ELSE
          0
        END)
END
Last Year:
CASE
   WHEN SUM(CASE WHEN `Period Type` = 'Last Year' THEN 1 ELSE 0 END) = 0 THEN
   0
ELSE
   SUM(CASE WHEN `Period Type` = 'Last Year' AND `Anonymous`='Y' THEN
         1
       ELSE
         0
       END)
    /
    SUM(CASE WHEN `Period Type` = 'Last Year' THEN
          1
        ELSE
          0
        END)
END
This Year:
CASE
   WHEN SUM(CASE WHEN `Period Type` = 'Current' THEN 1 ELSE 0 END) = 0 THEN
   0
ELSE
   SUM(CASE WHEN `Period Type` = 'Current' AND `Anonymous`='Y' THEN
         1
       ELSE
         0
       END)
    /
    SUM(CASE WHEN `Period Type` = 'Current' THEN
          1
        ELSE
          0
        END)
END
You can then graph by Quarter to get the amounts for This Quarter, Last Quarter, Last Year's Quarter utilizing these beastmodes.

Domo IDEAs Conference - Beast Modes - Number Formatting
Greetings! This is another post highlighting a beast mode from my Domo IDEAs conference session. This one covers how to format numbers a number when concatenating with a string.
Problem:
When concatenating a string with a number the resulting value is a string and unable to utilize Domo's built in formatting.
Solution:
Check the length of the number using the LENGTH function and then get the appropriate segments of the number using SUBSTRING and then combining them all together using CONCAT
-- Author:
-- Created:
-- Last Modified:
-- Description:
-- Checks the length of a number to determine how to insert thousands separators (,) using SUBSTRING to get 3 digit pieces of the number.

CONCAT('Total Amount: ',
  CASE WHEN LENGTH(ROUND(SUM(`random_number`), 0)) = 12 THEN
  CONCAT(
  SUBSTRING(ROUND(SUM(`random_number`), 0), 1, 3), ',',
  SUBSTRING(ROUND(SUM(`random_number`), 0), 4, 3), ',',
  SUBSTRING(ROUND(SUM(`random_number`), 0), 7, 3), ',',
  SUBSTRING(ROUND(SUM(`random_number`), 0), 10, 3)
  )
WHEN LENGTH(ROUND(SUM(`random_number`), 0)) = 11 THEN
  CONCAT(
  SUBSTRING(ROUND(SUM(`random_number`), 0), 1, 2), ',',
  SUBSTRING(ROUND(SUM(`random_number`), 0), 3, 3), ',',
  SUBSTRING(ROUND(SUM(`random_number`), 0), 6, 3), ',',
  SUBSTRING(ROUND(SUM(`random_number`), 0), 9, 3)
  )
WHEN LENGTH(ROUND(SUM(`random_number`), 0)) = 10 THEN
  CONCAT(
  SUBSTRING(ROUND(SUM(`random_number`), 0), 1, 1), ',',
  SUBSTRING(ROUND(SUM(`random_number`), 0), 2, 3), ',',
  SUBSTRING(ROUND(SUM(`random_number`), 0), 5, 3), ',',
  SUBSTRING(ROUND(SUM(`random_number`), 0), 7, 3)
  )
WHEN LENGTH(ROUND(SUM(`random_number`), 0)) = 9 THEN
  CONCAT(
  SUBSTRING(ROUND(SUM(`random_number`), 0), 1, 3), ',',
  SUBSTRING(ROUND(SUM(`random_number`), 0), 4, 3), ',',
  SUBSTRING(ROUND(SUM(`random_number`), 0), 7, 3)
  )
WHEN LENGTH(ROUND(SUM(`random_number`), 0)) = 8 THEN
  CONCAT(
  SUBSTRING(ROUND(SUM(`random_number`), 0), 1, 2), ',',
  SUBSTRING(ROUND(SUM(`random_number`), 0), 3, 3), ',',
  SUBSTRING(ROUND(SUM(`random_number`), 0), 6, 3)
  )
WHEN LENGTH(ROUND(SUM(`random_number`), 0)) = 7 THEN
  CONCAT(
  SUBSTRING(ROUND(SUM(`random_number`), 0), 1, 1), ',',
  SUBSTRING(ROUND(SUM(`random_number`), 0), 2, 3), ',',
  SUBSTRING(ROUND(SUM(`random_number`), 0), 5, 3)
  )
WHEN LENGTH(ROUND(SUM(`random_number`), 0)) = 6 THEN
  CONCAT(
  SUBSTRING(ROUND(SUM(`random_number`), 0), 1, 3), ',',
  SUBSTRING(ROUND(SUM(`random_number`), 0), 4, 3)
  )
WHEN LENGTH(ROUND(SUM(`random_number`), 0)) = 5 THEN
  CONCAT(
  SUBSTRING(ROUND(SUM(`random_number`), 0), 1, 2), ',',
  SUBSTRING(ROUND(SUM(`random_number`), 0), 3, 3)
  )
WHEN LENGTH(ROUND(SUM(`random_number`), 0)) = 4 THEN
  CONCAT(
  SUBSTRING(ROUND(SUM(`random_number`), 0), 1, 1), ',',
  SUBSTRING(ROUND(SUM(`random_number`), 0), 2, 3)
  )
WHEN LENGTH(ROUND(SUM(`random_number`), 0)) <= 3 THEN
  ROUND(SUM(`random_number`), 0)
WHEN SUM(`random_number`) IS NULL THEN 0
ELSE 'ERROR'
END
)
Note:
These beast modes only go to 100 Billion (12 digits). Any number higher would need to expand using the same logic for higher lengths.
Comment out tiles in MagicETL
When building complex ETLs it would be handy to be able to "comment out" tiles so they are ignored for execution. For bonus points, I'd like to be able to have an unterminated chain of commented-out tiles not block the ETL's execution.
 jimsteph
Option to label the date range on a card
I often hide the date range on card details because there is no way to indicate what the range is for. Launch date? Expiration date? Data upload date?

Would LOVE to see a text box perhaps here (yellow highlight below) that would allow me to write text before the date range. In the example above, I would write "Activity through:" and see "Activity through: Aug 18, 2014 - May 22, 2023".

I am picturing similar functionality to this feature in card builds - you can write a Data Label to override a column name for cosmetic purposes. I'm imagining an empty box where, if filled in, you can write a prefix for the date shown on card details.