Best Of
Mandatory filter selection
We need the ability to enforce a filter selection for apps and pages. We create apps and pages that require a filter and when removing all filters, leads to nonsensical views. If you look at these past community posts, you will see that this has been an issue for a while now.
https://community-forums.domo.com/main/discussion/59188/require-filter-selections/p1
https://community-forums.domo.com/main/discussion/54123/mandatory-single-select-filter
https://community-forums.domo.com/main/discussion/65881/force-a-filter-selection-on-filter-card

Ability to Complete Projects
Currently, in Projects and Tasks there is not a way to Complete a Project as a whole. You are able to complete all of the individual tasks but there is not a way to complete the project as a whole. You can Delete the project but not show it was completed.
September GA & Beta Preview
Sharing a preview of features coming to GA and Beta next week as part of our September Release.
Be sure to join our beta program to get access to beta features!
—New Features / Feature Enhancements—
Magic ETL Enhancements - Observability
Output row preview
View real-time row counts directly on the canvas as data transforms from tile to tile, letting you pinpoint data quality issues faster
DataFlow Versioning
Inspect prior iterations and logic across historical DataFlow versions allowing you to reference past configurations and audit pipeline changes side-by-side.
Execution details heatmap
Spot resource-heavy actions instantly with visual performance heatmaps paired with targeted telemetry metrics to isolate bottlenecks or row-drop anomalies.
User settings persistence
Eliminate repetitive setup by automatically saving custom canvas preferences and layout configurations across your DataFlows and open them with preferred specifications every time.
MagicETL Enhancements – Customizable Canvas
The new customizable canvas features in Magic ETL let you tailor layouts, navigation, and visual themes to build and manage complex data flows faster and with less visual friction.
Canvas Navigation Controls
Effortlessly pan, zoom, and inspect complex ETL workflows with greater precision using new click-to-drag and scroll-to-zoom canvas controls and a familiar, map-style navigation experience.
Custom Window Layouts
Tailor your design canvas to your preference by moving, resizing, or pinning individual tool panels to help you eliminate visual clutter and build data pipelines faster.
Dark Mode
Reduce eye strain during extended build sessions by switching your canvas interface to a high-contrast dark theme.
MagicETL – Tile Enhancements
Transform and process data faster with purpose-built tiles. The latest tile enhancements in Magic ETL expand your pipeline capabilities with native AI modeling, flexible SQL outputs, and simplified column management to help you automate complex logic directly on the canvas.
New AI Sentiment Analysis Tile
Automatically analyze customer feedback, survey responses, and support tickets to detect emotional tone directly within your data pipelines to instantly score sentiment without writing code or calling external APIs.
New AI Classification Tile
Automatically categorize unstructured text fields into standardized tags or predefined custom categories, eliminating manual data sorting and tagging tasks to organize large text datasets at scale.
New Multi-statement SQL Tile
Write custom SQL logic that processes multiple input DataSets and generates multiple distinct output streams eliminating the need for chained tiles or redundant data passes, reducing execution time and canvas complexity.
Convert tiles to SQL
Convert any standard Magic ETL tile or series of configured tile actions directly into a readable SQL script with a single click for full visibility into generated query logic.
Update to Select Columns tile
Streamline dataset schema management with an upgraded interface allowing you to easily search, select, deselect, or modify multiple column metadata attributes at once.
AI Chat Updates
Multiple updates to AI Chat make it faster and more capable than ever.
- Gathering Context - Bring context directly into your chat with @ mentioning DataSets , Dashboards, Cards, Apps or Documents or drag and drop local files or images to analyze unstructured data
- Complex Multipart Questions – ask complex questions across multiple DataSets and Documents
- Let AI Chat Build Assets – Preview and deploy drafts directly from your conversation or let chat delegate to sub-agents across App Studio, MagicETL & Code Engine
- Custom chat - Admins can replace the default AI Chat with specialized custom assistants configured for specific apps or entire accounts.
- Workspace focus - AI Chat automatically aligns its context based on the specific workspace or page you are currently viewing
- Sustained conversations - Enjoy longer interactions that retain context, including previous tool calls, across many turns
- General Questions - Ask about general topics and get real answers
- DomoStats AI Operations Report - See a complete breakdown of every Domo AI Pro operation in a single report
- Knowledge Base Support - Ask Domo-specific questions to troubleshoot or find answers without leaving your active chat window
MCP Trigger
If a workflow is triggered by Claude, AI Chat, or an autonomous agent, you’ll see a clear, consistent audit trail in your Workflow Execution Details page enabling you to monitor, audit, and govern how AI interacts with core business processes.
Code Engine Package Management
Developers get real-time visibility into the reach and usage of each package, and secure capabilities for smart deletion of packages that are no longer used or referenced.
Improved versioning
Select, switch, or version your functions with far fewer clicks and the confidence that your existing parameter mappings will remain intact.
DataSet Query Task Updates
Save configurations and generate output parameters on zero-row results. This means your query no longer has to produce at least one row of data to save your progress.
Pvariable Support for Dashboards, App Studio & Embed
pVariable support allows business users and admins to easily drive dashboards, App Studio pages, and embeds using simple URL parameters on load.
Card Embed Enhancements
An improved embedded user interface and expanded customization to enable or disable features such as segments, quick filters, and variables, along with configuring parameters like background, scale and text color to match your brand.
—Beta Features—
Magic ETL: Unstructured data processing
The new Documents Input Tile brings native unstructured data processing to Magic ETL, enabling you to seamlessly ingest and combine file-based content directly into your data pipelines
Snowflake Semantic Views
Register existing Snowflake Semantic Views in Domo and query directly, taking advantage of the synced relationships, business definitions and metrics defined and governed in Snowflake.
AI Library w/ New MCP Toolkits
Domo MCP toolkits safely integrate AI assistants and agents into daily operations while maintaining strict platform security and governance, accessible whether you’re using external models or custom agents built in Domo via the AI library.
MCP Toolkits - Automation
Manage workflow lifecycles to create, validate, test-run, and deploy automated definitions and build and manage forms. Deploy Code Engine custom business logic, version unreleased code, and securely execute background functions. Coordinate approvals in Task Center, letting AI manage queues, review tasks, and monitor watchlists.
MCP Toolkits – Workspaces & Alerts
Allow agents to securely create and manage Workspaces as well as folders, alerts and subscriptions to safely offload administrative tasks without compromising security.
MCP Toolkits – Sandbox
Create, commit, promote, and delete repositories, as well as manage sharing of them with a new universal orchestration skill routing requests to the appropriate tool based on your intent.
Calculated Columns: Rule builder
Provides a visual and guided interface that allows users to create, edit, and manage conditional columns wherever calculated fields are created in Domo without writing DQL.
Cloud Integrations: Calendar upgrades (fiscal & internationalization)
Seamlessly apply your company’s unique fiscal calendar and regional settings directly at the integration level by registering an existing fiscal calendar table hosted on your Snowflake, Databricks, or BigQuery instance.
Activity Log Webhook
Stream platform audit events to external systems in real time for immediate security and compliance monitoring, allowing security teams to respond to issues immediately.
Enable export and import of JSON connector definitions
Share and reuse API configurations as JSON files instead of rebuilding them manually every time, automating the connection process and reducing manual overhead.
Allow Left Navigation Panel to Stay Expanded in App Studio
The left navigation panel in App Studio is collapsed by default and expands when users hover over it.
It would be helpful to have an option to keep the navigation panel permanently expanded (pinned open). For apps with multiple pages, having page names visible at all times can make navigation more intuitive and efficient
Allow Gauge Charts to Compare Against Multiple Target Values
Gauge charts support comparing a primary value against a single target value. It would be valuable to support multiple target/comparison values within the same Gauge visualization.

Example:
- Gauge Value = Income
- Target 1 = vs Last Year (LY)
- Target 2 = vs Budget
Alternatively, the comparison values could represent different periods or benchmarks, such as:
- Month-over-Month (MoM)
- Year-over-Year (YoY)
- Budget
- Forecast
This would allow users to evaluate performance against multiple key benchmarks in a single visual, reducing the need for multiple gauges and making comparisons more efficient.
Does SQL editor for Dataset views support Common Table Expression (CTE) ?
Title: CTE Support in Domo Dataset Views
Hi fellow Domo Developers,
Has anyone successfully created a Dataset View using a CTE (WITH clause)?
I’m currently trying to build a Dataset View using a CTE, but Domo throws an error and appears to interpret the CTE name as a source dataset instead of resolving it as a CTE.
I wanted to confirm whether CTEs are supported in the Dataset View SQL editor, or if this is a known limitation of Dataset Views.
If anyone has implemented CTE-based logic successfully, could you please share the approach or any workaround you used?
Thanks in advance!
"Fixed Pane" Separator
A key frustration with Domo is, when scrolling, any filters, controls etc. disappear and to make changes the user must scroll back to the top (when they are located there as is often the case). I know the filters are accessible via the button but this is not obvious to many users and often unintuitive.
With the ability to have a fixed pane option (like in Excel) elements above this separator would remain on the page and independent of any scrolling allowing to much quicker changes to filters and controls and greatly enhancing the user experience.
 TC777
TC777
Magic ETL - Selectable Preview
While you expanded the amount of rows that can run for a preview, what would be even better is being able to select data that is previewed, even if it's something like most recent 400K rows. Changes that we generally make to an ETL is due to updates in the data flowing through but it's difficult to test that logic when the ETL only tests the first set of rows or a random set of rows. I then have to create copies or Views of datasets, filtered to the rows I need to test, so I can preview that my change in logic worked before reverting back to the original datasets and rerunning the full dataflow.
 amthomas
Pivot Table Expansion
Can we have Pivot Table to expand categories in 1 column like this?

instead of the expansion is in another column?

App Studio – Require One Value to Always Be Selected in a Filter
I have several global dropdown filters in an App Studio page (Region, Country, Account Language, etc.) that apply to all visualizations on the page.
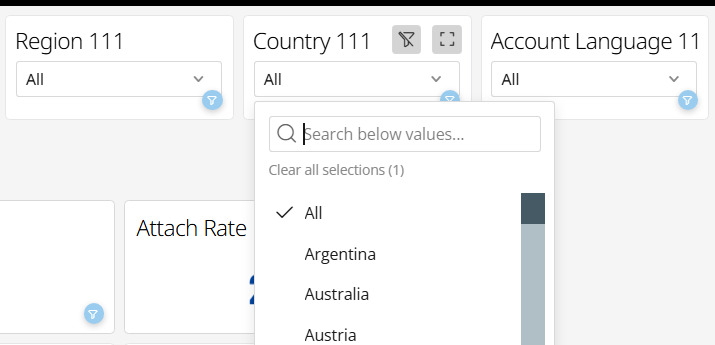
For these dimensions, the underlying dataset includes a pre-aggregated “All” value. For example, Country = All contains metrics already aggregated across all countries. Because of this, each of these filters needs to have exactly one value selected at all times.
The issue is that Domo shows the Clear Filter (strikethrough funnel) icon on each filter.
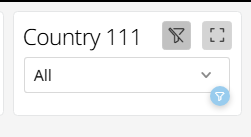
If a user clicks it, the filter becomes unselected. Domo then includes both the individual country rows and the pre-aggregated All rows, which effectively double-counts the metrics.
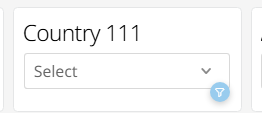
Is there a way to:
- Disable/hide the Clear Filter icon for specific filters, or
- Configure a filter so that one value must always remain selected and the user cannot clear the selection entirely?
Tableau has a straightforward option to prevent an “All”/unfiltered state for a filter. I haven't been able to find an equivalent setting in Domo App Studio, but this seems like a fairly fundamental requirement when working with pre-aggregated data.
Am I missing a setting that supports this in Domo?
vash_ps