Formatting a table

NathanDorsch
Member
in Beast Mode
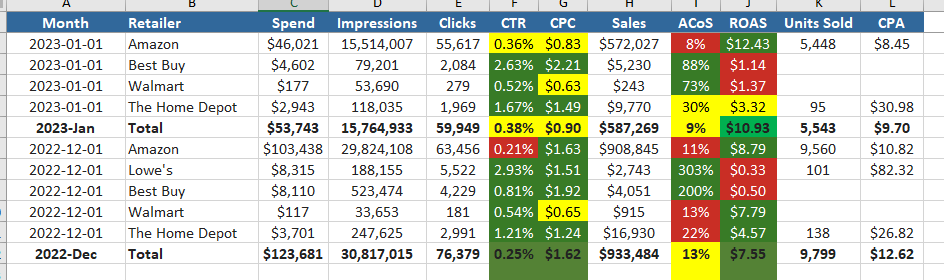
I have a table which I would like to have sub-rows providing sub-total numbers for each month. It currently looks like this.

How do I get it to look like this? Where the total rows are emboldened, the color coding applies to their respective columns, the “Count x/y” is replaced with Total in the Retailer field, and the Month simply just has the same month date format…
0
Best Answer
-
@NathanDorsch Here are some settings you can use to get the formatting closer to your screenshot:
- Apply color rules to subtotals under Chart Properties > General > Apply Color Rules to Total and Subtotals
- Make subtotals bold under Chart Properties > Subtotal Rows > Subtotal Font Style
- Remove the “Count x/y” under Chart Properties > Subtotal Rows > Hide Counts
1

Answers
-
@NathanDorsch Here are some settings you can use to get the formatting closer to your screenshot:
- Apply color rules to subtotals under Chart Properties > General > Apply Color Rules to Total and Subtotals
- Make subtotals bold under Chart Properties > Subtotal Rows > Subtotal Font Style
- Remove the “Count x/y” under Chart Properties > Subtotal Rows > Hide Counts
1
Categories
- All Categories
- 2K Product Ideas
- 2K Ideas Exchange
- 1.6K Connect
- 1.3K Connectors
- 311 Workbench
- 6 Cloud Amplifier
- 9 Federated
- 3.8K Transform
- 659 Datasets
- 117 SQL DataFlows
- 2.2K Magic ETL
- 816 Beast Mode
- 3.3K Visualize
- 2.5K Charting
- 84 App Studio
- 46 Variables
- 778 Automate
- 190 Apps
- 482 APIs & Domo Developer
- 83 Workflows
- 23 Code Engine
- 41 AI and Machine Learning
- 20 AI Chat
- 1 AI Playground
- 2 AI Projects and Models
- 18 Jupyter Workspaces
- 411 Distribute
- 120 Domo Everywhere
- 280 Scheduled Reports
- 11 Software Integrations
- 145 Manage
- 141 Governance & Security
- 8 Domo Community Gallery
- 48 Product Releases
- 12 Domo University
- 5.4K Community Forums
- 41 Getting Started
- 31 Community Member Introductions
- 115 Community Announcements
- 4.8K Archive