Count Distinct Variance

Hello,
I am currently creating a bar chart where I use a count distinct formula for unique client IDs as the y-axis, and the series is location. I've noticed that when i add or remove the series from the bar chart, the y-axis's values change. I'm not sure what is going on, any advice would be helpful. Thanks!
0
Answers
-
Your differing values is because you likely have a client id in multiple locations. For example, if your data looks like this:
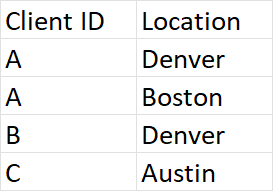
Your distinct client id count is 3.
However, when broken out by location, your counts look like this:
Denver - 2
Boston - 1
Austin - 1
Adding those totals up equals 4 because client ID A is in two different cities. You should expect different counts because clients are in multiple cities.
Hope this helps.
**Check out my Domo Tips & Tricks Videos
**Make sure to any users posts that helped you.
**Please mark as accepted the ones who solved your issue.0

Categories
- All Categories
- Product Ideas
- 2.1K Ideas Exchange
- Connect
- 1.3K Connectors
- 309 Workbench
- 7 Cloud Amplifier
- 10 Federated
- Transform
- 665 Datasets
- 120 SQL DataFlows
- 2.3K Magic ETL
- 827 Beast Mode
- Visualize
- 2.6K Charting
- 90 App Studio
- 46 Variables
- Automate
- 198 Apps
- 489 APIs & Domo Developer
- 97 Workflows
- 24 Code Engine
- AI and Machine Learning
- 23 AI Chat
- 4 AI Projects and Models
- 18 Jupyter Workspaces
- Distribute
- 119 Domo Everywhere
- 284 Scheduled Reports
- 11 Software Integrations
- Manage
- 145 Governance & Security
- 13 Domo Community Gallery
- 49 Product Releases
- 13 Domo University
- Community Forums
- 41 Getting Started
- 31 Community Member Introductions
- 117 Community Announcements
- 5K Archive