Currently using a Line Bar chart, to graph issue creation vs issue closure over different time periods, which also allows us to have a running total line that shows the total change.
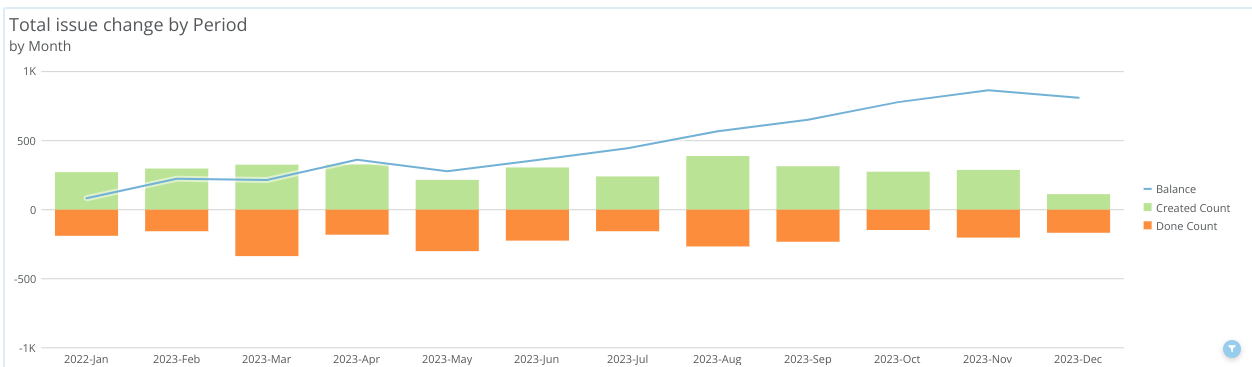
However, we would like the total line to show the actual total for all time, so instead of starting from 0, the first month should start with the actual All Time history regardless of the Time Range that has been selected to be displayed. I'd need to do this via Beast Modes, as people can select different filters at the card/dashboard level, and also switch the date grouping as needed. I was thinking perhaps replacing the line with a beast mode that uses Windows Functions or the Fixed function would work, but haven't been able to come up with the right syntax. So the outcome should look like the red line below, basically the blue running total we already have but uplifted by the preexisting balance (outside the selected date range):

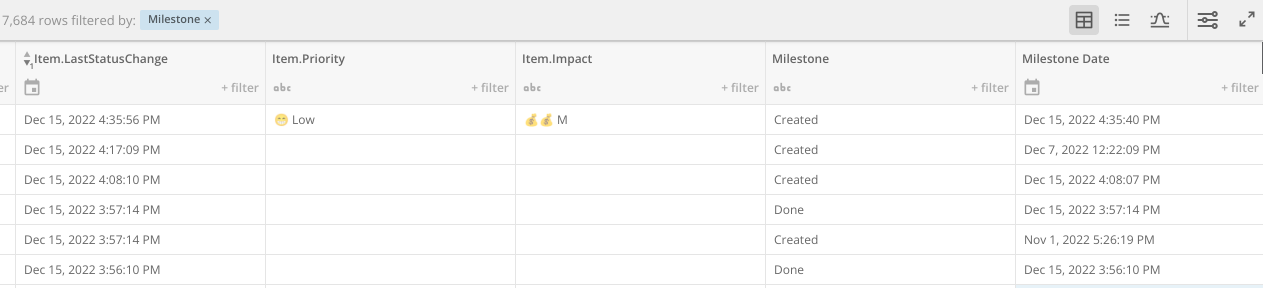
My raw data currently has 3 key columns: Milestone (to tell what happened, like created vs closed), Milestone Date (when it happened) and the Issue ID, plus additional columns that are used for filtering.
Any ideas?