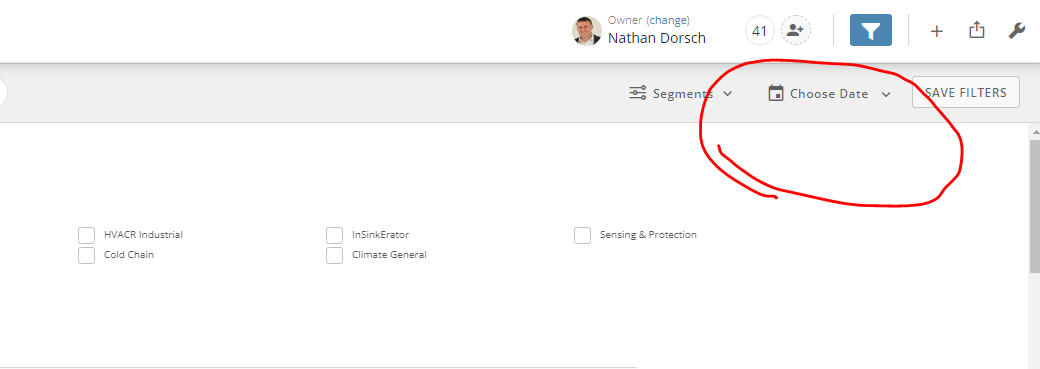
Can someone explain how the filter in the upper right part of the dashboard works?
Does it filter charts by all dates that exist within their datasets? For example, if I have a dataset that has multiple date fields (registration date, order date, shipping date, returned date, etc.) and I select a date range of 1/1-1/7... does it filter out all rows of data in which any of the date values fall outside that range?
Or does it only filter charts with dates?