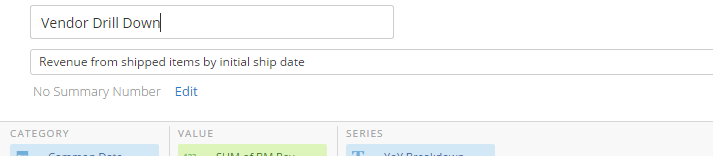
I have a table with overall vendor data, I want to be able to display a graph as a drill down that graphs the data by month. In the top level view there is no interval selector, since the card is a table:

Editing the drill down does not let me change the date interval:
Any advice here?


