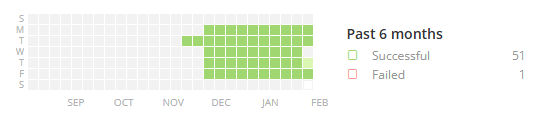
The current magic ETL history page for any particular ETL shows the run successes near the top of the page, in a style that looks similar to a history of git-commits. Hovering over a square shows the number of successful runs on that date. We would like to implement some method of process control visible to all domo users and feel that this space would be a good location to start.
I think that a more useful purpose of this space would be to show the run time history of that ETLs executions as a process control chart. Instead of showing green squares to indicate that date had a successful run, can this instead be a time chart that shows that last n-number of runs and (on the y-axis) show the run time for those runs? Each run can be marked via a point on a trend line, and each point can still be marked red or green for success or failure.
This still allows users to see the same information of run success status, but also provides the run time as a trend over the last n-number of runs. This is helpful to identify ETLs that are starting to uptick in process time, or identify ETLs that happened to take longer than usual.
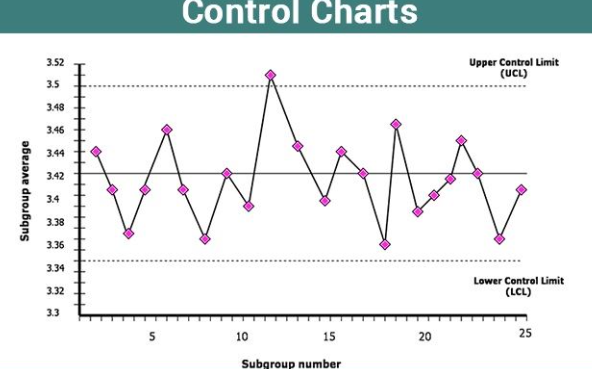
Attached is an image of a Control Chart that displays the idea behind statistical process control. The x-axis would display the start times of magic ETLs and the y axis would be the execution time. Ideally, we would be able to apply control limits to these charts and set alerts on them, giving us full SPC capability within Domo!