Multi-line graphs should behave the same in a trellis or not for single-points

DavidChurchman
Contributor

in Other Ideas
I have a survey that we've administered across multiple years to different school districts. One of the main topics of interest is how different roles have changed over time. Using a multiline graph in a trellis does a great job visualizing that for a district that has taken it multiple times:
However for a district taking it the first time, not so much:
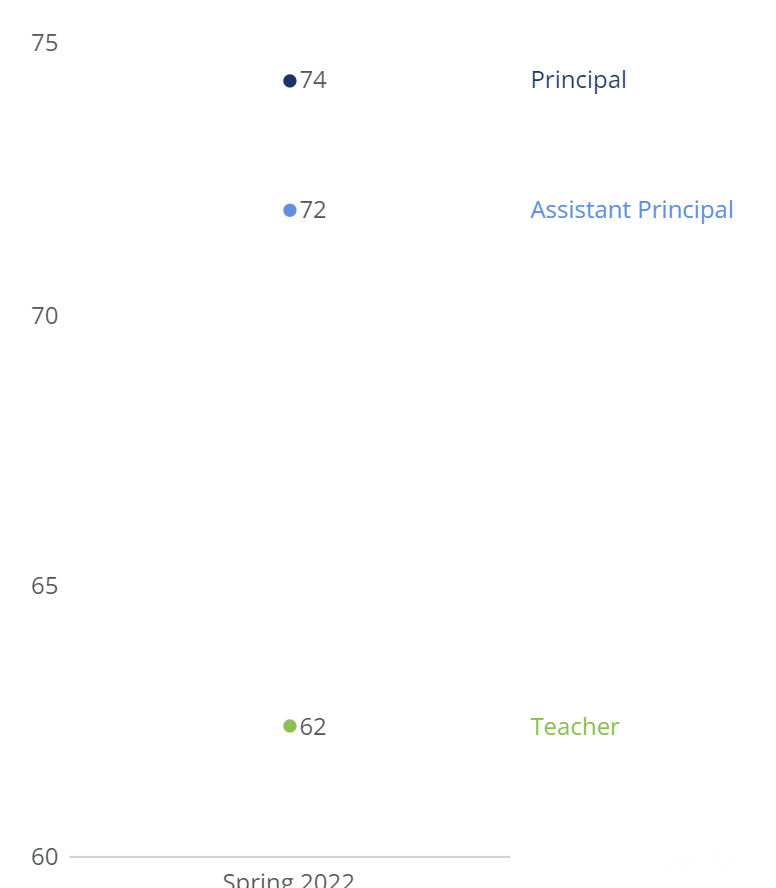
When I take the multi-line out of the trellis, it behaves the way I would want it to, showing a point for values with only a single year:
The multi-line should behave the same way in the trellis as it does without a trellis. When I submitted a support ticket, they said this is the expected behavior. If it's the expected behavior, why isn't it consistent in a trellis/not in a trellis?
2
Categories
- All Categories
- 1.2K Product Ideas
- 1.2K Ideas Exchange
- 1.3K Connect
- 1.1K Connectors
- 273 Workbench
- 1 Cloud Amplifier
- 3 Federated
- 2.7K Transform
- 78 SQL DataFlows
- 525 Datasets
- 2.1K Magic ETL
- 2.9K Visualize
- 2.2K Charting
- 434 Beast Mode
- 22 Variables
- 510 Automate
- 114 Apps
- 388 APIs & Domo Developer
- 8 Workflows
- 26 Predict
- 10 Jupyter Workspaces
- 16 R & Python Tiles
- 332 Distribute
- 77 Domo Everywhere
- 255 Scheduled Reports
- 66 Manage
- 66 Governance & Security
- 1 Product Release Questions
- Community Forums
- 40 Getting Started
- 26 Community Member Introductions
- 68 Community Announcements
- 4.8K Archive