Hi,
I am trying to create a chart by weeks showing
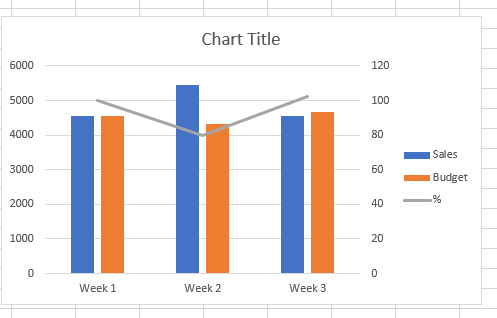
Sales as a bar
Budget as a bar
and then the variance between the 2 as a line.
I want the scale for the variance to be on the right hand side and the scale for sales and budget on the left.
I am trying lots of combinations but can't seem to find the one that fits.
Would anyone be able to point me in the right direction please?
The best I can do is as above but the variance scale ends up on the left. Can you swap these?
Like this
Thanks

