Tornado chart

MikeRoberts
Member
in Charting
Has anyone figured out how to present a tornado chart in Domo? There isn't a specific card for this but was trying to figure out if I could trick another chart type into doing what I needed. It requires a horizontal bar but with the ability for the bar to reflect a range which does not start at zero, and the ability to centre the bars around zero. An alternative if the range does not centre on zero, would be to be able to centre the bars around a mean or median.
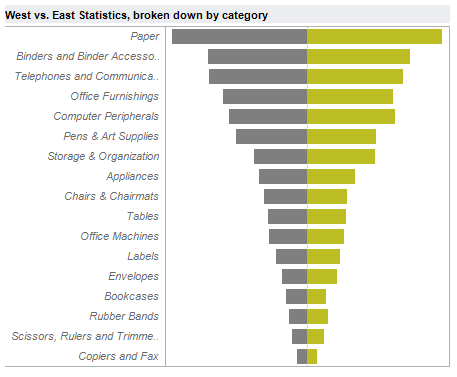
Here's an example...
Thanks
0
Answers
-
You can do this with a horizontal bar chart. You will need to use zero as your center and turn one series negative. Use another beast mode in your sorting that would take the positive sum of each category to get it sort like a tornado.
**Check out my Domo Tips & Tricks Videos
**Make sure toany users posts that helped you.
**Please mark as accepted the ones who solved your issue.1
Categories
- All Categories
- 2K Product Ideas
- 2K Ideas Exchange
- 1.6K Connect
- 1.3K Connectors
- 311 Workbench
- 6 Cloud Amplifier
- 9 Federated
- 3.8K Transform
- 659 Datasets
- 116 SQL DataFlows
- 2.2K Magic ETL
- 815 Beast Mode
- 3.3K Visualize
- 2.5K Charting
- 82 App Studio
- 45 Variables
- 776 Automate
- 190 Apps
- 481 APIs & Domo Developer
- 82 Workflows
- 23 Code Engine
- 40 AI and Machine Learning
- 20 AI Chat
- 1 AI Playground
- 1 AI Projects and Models
- 18 Jupyter Workspaces
- 410 Distribute
- 120 Domo Everywhere
- 280 Scheduled Reports
- 10 Software Integrations
- 144 Manage
- 140 Governance & Security
- 8 Domo Community Gallery
- 48 Product Releases
- 12 Domo University
- 5.4K Community Forums
- 41 Getting Started
- 31 Community Member Introductions
- 114 Community Announcements
- 4.8K Archive