Add a line option for symbols... and the ability to add multiple measure and a dimension to charts

G_Grey
G_Grey Contributor
edited December 2023 in Charting Ideas

Alright, so picture this. Your CEO wants to know if you're hitting goal and who is and is not contributing to the team so that he can deliver high praise or the ultimate corporate smack down.

Should be a simple enough task. Here's your table:

But then you go to a bar / symbol chart and you gots yourself an issue! You can only have one measure and a series....


A solution is you could simply make your dataset way more complicated than it needs to be by adding a bunch of calculated columns


When all we really need to answer this simple question is some functionality that allows you to do a bit of both. My dream would be for the chart to work like this and then I could spend my morning doing what I originally planned to do -- commandeering a ship, picking up a crew in Tortuga, then raid, pillage, plunder, and otherwise pilfer my weaselly black guts out.


Come to think of it... One more thing!

Do you know the mental impact and supreme joy that seeing bars punch through lines brings to executives hearts? You want to rock their world? Add a line option to the bar/symbol chart. Seriously to you it may look like dis:
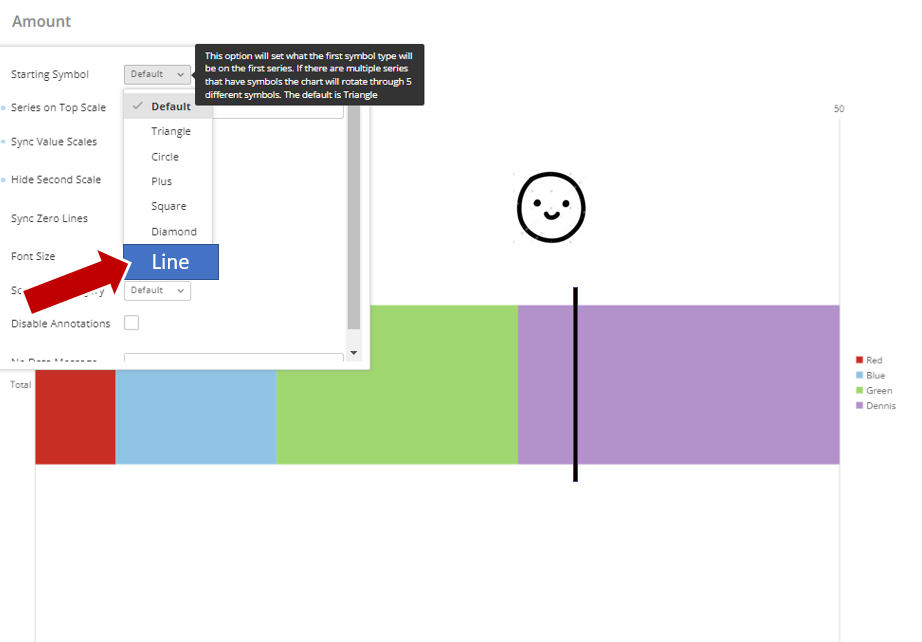

But to them it looks like this:


3
3 votes

Active Β· Last Updated

Comments

  • G_Grey
    G_Grey Contributor

    Want to really rock their world, add multiple lines! Seeing a sales bar punch through forecast line, budget line, and some other goal line exceeding multiple expectations. Oh man. The more lines the better!

  • A lot of what you're describing can be done with bullet charts. It has that satisfying goal line for the bar to punch through, as well the ability to shade incremental goals in the background before the one big goal. You can't break it up into a stacked series, but I think you would end up with something easier to interpret than a stacked bar


    Please πŸ’‘/πŸ’–/πŸ‘/😊 this post if you read it and found it helpful.

    Please accept the answer if it solved your problem.

  • G_Grey
    G_Grey Contributor
    edited December 2022

    @DavidChurchman Totally aligned, I use bullet charts all the time. I think this is really helpful to point out on this post because I adore bullet charts.

    The limitation that I run into is that the business wants to see more than one singular sales bar (so a stacked bar) and they also love the 'bar symbol' tremendously. So they naturally and frequently ask 'can't you just take the stacked bar, and make it look like the bullet chart but with a few elements from each'. Which is a simple sounding and very intuitive thing for them to ask from a design and concept perspective. It results in a furled eyebrow and disappointment when get told 'DOMO doesn't offer that option unfortunately.' Which diminishes the user's experience.