How to hide target in Bullet Chart

I want to create a chart that displays the percentage of opportunities that have closed. I created a Beast Mode that displays a 1 if the Opp has closed and a 0 if it hasn't closed. I then threw it into a bullet chart, categorized by Lead Source. This is all well and good, but I don't want the target value to be visible (see below).
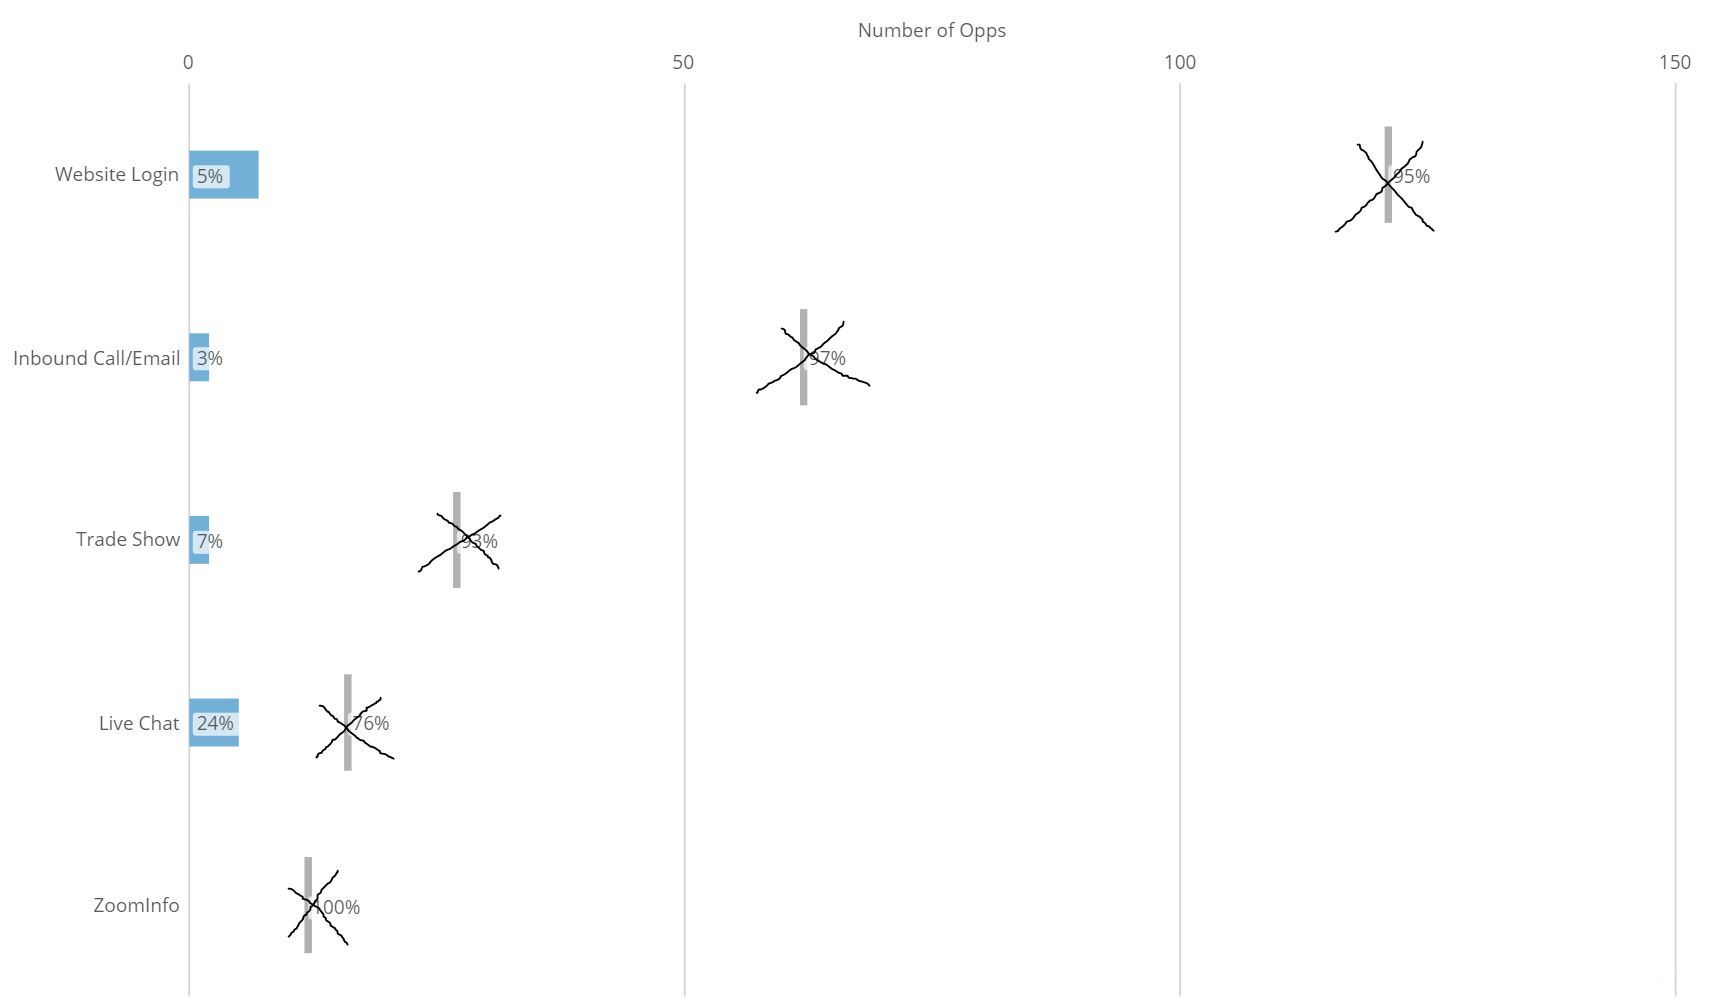
As you can see, the actual bar part of the chart is pretty small, and the target value is useless to me. Can I get rid of the target while maintaining the correct percentages? Do I need to use a different graph for this?
Best Answer
-
I've solved it, I simply needed to put the Lead Source on the y-axis with the Beast Mode Grant mentioned above on the x-axis. No series needed, and here's my output:
 0
0
Answers
-
Have you tried using a beast mode to calculate your percentage instead of just if it's a 1 or 0?
SUM(CASE WHEN [logic for is closed] THEN 1 ELSE 0 END) / SUM(1)
Use that in a horizontal bar chart as the display text but the closed opportunity count as your x value. Make sure you use your Lead Source as the series.
**Was this post helpful? Click Agree or Like below**
**Did this solve your problem? Accept it as a solution!**0 -
If my x-axis is the number of Closed Opps, what would my y-axis be? I made the Beast Mode but I'm not sure how it fits into my graph. I want something like this, where the blue portion is completely gone, leaving just the green bars with their respective percentages
 0
0 -
I've solved it, I simply needed to put the Lead Source on the y-axis with the Beast Mode Grant mentioned above on the x-axis. No series needed, and here's my output:
0

Categories
- All Categories
- Product Ideas
- 2.1K Ideas Exchange
- Connect
- 1.3K Connectors
- 309 Workbench
- 7 Cloud Amplifier
- 10 Federated
- Transform
- 666 Datasets
- 120 SQL DataFlows
- 2.3K Magic ETL
- 827 Beast Mode
- Visualize
- 2.6K Charting
- 90 App Studio
- 46 Variables
- Automate
- 198 Apps
- 489 APIs & Domo Developer
- 97 Workflows
- 24 Code Engine
- AI and Machine Learning
- 23 AI Chat
- 4 AI Projects and Models
- 18 Jupyter Workspaces
- Distribute
- 118 Domo Everywhere
- 284 Scheduled Reports
- 11 Software Integrations
- Manage
- 145 Governance & Security
- 13 Domo Community Gallery
- 49 Product Releases
- 13 Domo University
- Community Forums
- 41 Getting Started
- 31 Community Member Introductions
- 117 Community Announcements
- 5K Archive