Multiple Date Columns

So I have a data set that looks basically like this:
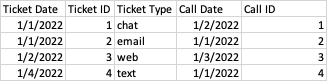
And I want to produce a card that counts the number of chats, emails, web, and text tickets by date, but also the number of calls by date. Then I need to sum up all interaction types by date.
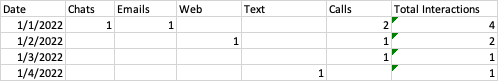
So for the above example, I would want this as the output:
Can anyone provide some tips on how I might achieve this with cards? Do I need to create a custom data set to somehow pivot this data into this format? How would you deal with the multiple date columns?
Comments
-
I would probably do this in Magic ETL and do a combination of grouping and pivoting.
You could do a group by tile (on your input) on ticket date and ticket type and count ticket id - then use a pivot tile to create a column for each of your ticket types, which would give you the first half of your table. Then you could do a second group by tile (also from your input) on call date and count call id. Then use a join to join this to the pivot tile output by joining on date. This'll give you the output you're looking for but you lose the transactional detail of the ids.
Alternatively you could restructure your dataset so that every row is a single transaction, which may give more flexibility long term. You could do a select columns tile to select the ticket date, ticket id, ticket type columns, and use a constant tile to add a new constant (i.e. contact_type) and set it to 'Ticket'. Then another select columns to just select ticket id, call date and call id, and add the constant tile for contact_type = 'Call'. I'd rename the ticket_date and call_date columns to 'Date' so they'll be the same when you append. It would look like this:
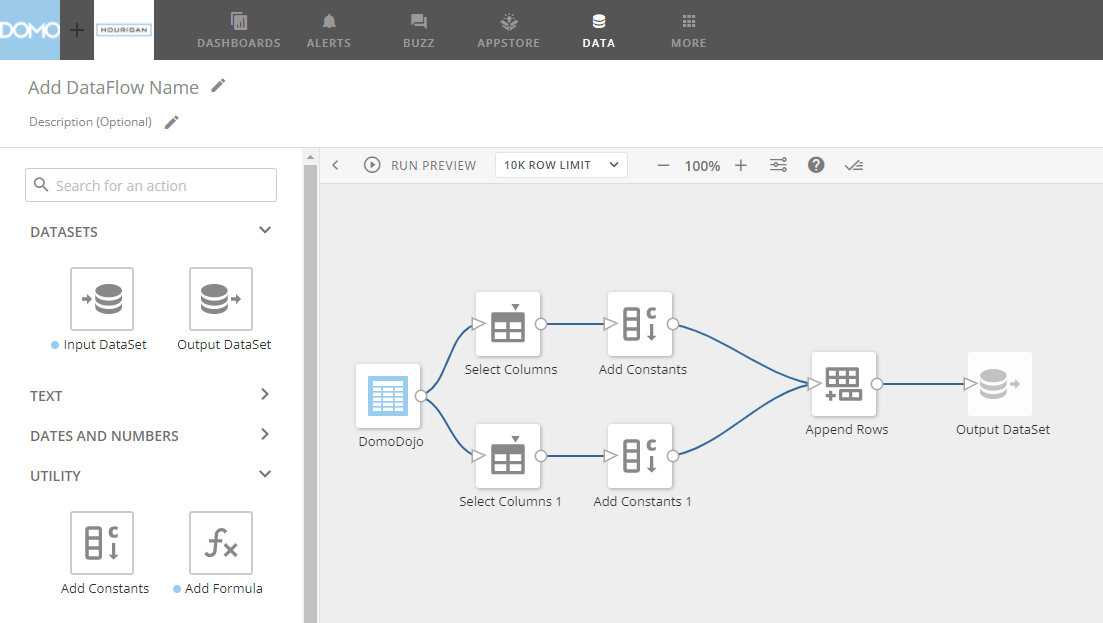
Then you could do your aggregation in the card via beast modes (or possibly a pivot table), or could use a dataset view and use that to power a card.
0

Categories
- All Categories
- 2K Product Ideas
- 2K Ideas Exchange
- 1.6K Connect
- 1.3K Connectors
- 308 Workbench
- 6 Cloud Amplifier
- 10 Federated
- 3.8K Transform
- 660 Datasets
- 117 SQL DataFlows
- 2.2K Magic ETL
- 815 Beast Mode
- 3.3K Visualize
- 2.5K Charting
- 84 App Studio
- 46 Variables
- 780 Automate
- 191 Apps
- 482 APIs & Domo Developer
- 84 Workflows
- 23 Code Engine
- 41 AI and Machine Learning
- 21 AI Chat
- 2 AI Projects and Models
- 18 Jupyter Workspaces
- 414 Distribute
- 122 Domo Everywhere
- 281 Scheduled Reports
- 11 Software Integrations
- 146 Manage
- 142 Governance & Security
- 8 Domo Community Gallery
- 49 Product Releases
- 12 Domo University
- 5.4K Community Forums
- 41 Getting Started
- 31 Community Member Introductions
- 115 Community Announcements
- 4.8K Archive