Adding multiple series in Grouped and Stacked Chart

Does someone know how can I create a grouped chart with 2 series?
I would like to sum value from 2 products filtered and compare it on the same graph. But it's a index view, so I have to calculate the index (done at the backend of the data) and sum all value from each range I've got, like this image
So I choose product 1 and product 2 (both on the same row with index column already calculated)
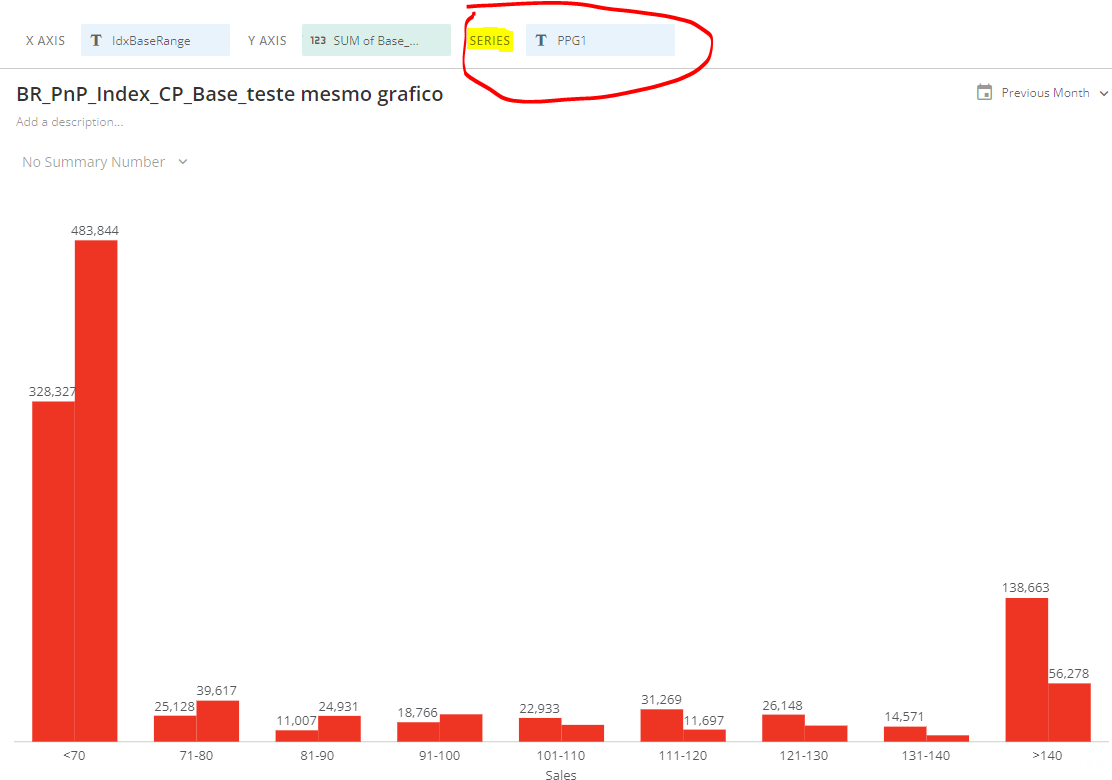
the thing is, if I could use multiple series, I could create the graph I need, but It would give me the opportunity to add one more.
Is that another chart I can use or something I can change to get this?
Best Answer
-
It needs to be a metric (number) and not a dimension (string). Once you have that you can then add multiple other metrics to your chart. With it being a dimension Domo is assuming all of your different series are within that dimension.
If you had one row per product instead of all the products on the same row you could use the method you're showing in your example.
**Was this post helpful? Click Agree or Like below**
**Did this solve your problem? Accept it as a solution!**1

Answers
-
Hi @Pedro_Valverde,
There's a graph, the 'Line + Grouped Bar' chart type [https://domohelp.domo.com/hc/en-us/articles/360043429153-Grouped-Bar-with-Line-Chart], that by default gives multiple bars and a single line for your defined measures. You'll have Series blocks available as you add in your measure.
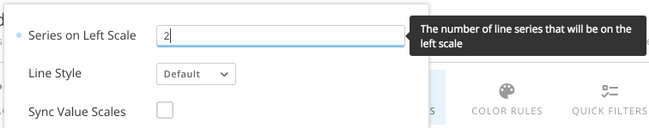
Also, if you want multiple lines instead, you can go the General section under Chart Properties and set the 'Series on Left Scale' option to however many lines you want.
Let me know if you are after something else.
11 -
Hi @amehdad,
It could be something, but my bd structure has series in different columns, as in the example you shared, the series is on the same column.
The importance of this chart is the index calculation/comparison I have for my products price. So I've match every product vs every product and create a index column at the end. With this I have in the same line product 1 description, product 1 sales volume, product 1 price, same fields for product 2 and also a index calculation between then.
That is because in beastmode I couldn't create a dynamic calculation of that.
0 -
It needs to be a metric (number) and not a dimension (string). Once you have that you can then add multiple other metrics to your chart. With it being a dimension Domo is assuming all of your different series are within that dimension.
If you had one row per product instead of all the products on the same row you could use the method you're showing in your example.
**Was this post helpful? Click Agree or Like below**
**Did this solve your problem? Accept it as a solution!**1 -
Thanks a lot all, now it's working!!
0

Categories
- All Categories
- 2K Product Ideas
- 2K Ideas Exchange
- 1.6K Connect
- 1.3K Connectors
- 308 Workbench
- 6 Cloud Amplifier
- 10 Federated
- 3.8K Transform
- 660 Datasets
- 117 SQL DataFlows
- 2.2K Magic ETL
- 815 Beast Mode
- 3.3K Visualize
- 2.5K Charting
- 84 App Studio
- 46 Variables
- 780 Automate
- 191 Apps
- 482 APIs & Domo Developer
- 84 Workflows
- 23 Code Engine
- 41 AI and Machine Learning
- 21 AI Chat
- 2 AI Projects and Models
- 18 Jupyter Workspaces
- 414 Distribute
- 122 Domo Everywhere
- 281 Scheduled Reports
- 11 Software Integrations
- 146 Manage
- 142 Governance & Security
- 8 Domo Community Gallery
- 49 Product Releases
- 12 Domo University
- 5.4K Community Forums
- 41 Getting Started
- 31 Community Member Introductions
- 115 Community Announcements
- 4.8K Archive