Flex Table Sorting by Pct Change

user012140
Member
in Charting
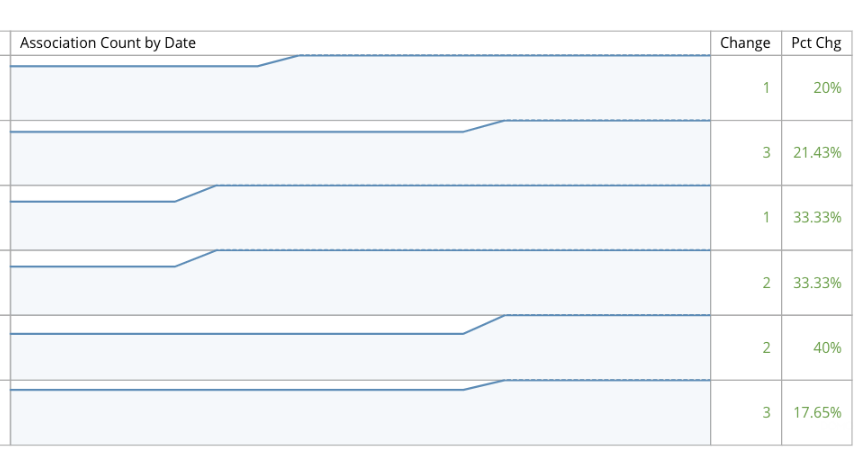
Is there a way to sort Flex tables by the % or value change? I want to show the top 20 rows that has the highest % or value change. I only see the option to sort by total which doesn't work for my use case. Thanks
0
Answers
-
If you can re-create that percent change in a beast mode then you can drag that beast mode into the sorting properties.
**Check out my Domo Tips & Tricks Videos
**Make sure to any users posts that helped you.
**Please mark as accepted the ones who solved your issue.0 -
How do I create the % change in beast mode? This is a calculated column from the Flex table
0 -
Typically it’s just
(‘New’-‘old’)/(‘new’) but it depends on how you have your percent change metric defined in the card settings. Which method are you using?
**Was this post helpful? Click Agree or Like below**
**Did this solve your problem? Accept it as a solution!**1 -
The percent change/value change is automatically calculated by the Flex table.
I'm looking at value and % change from the pentultimate value to the last value.
0


Categories
- All Categories
- 2K Product Ideas
- 2K Ideas Exchange
- 1.6K Connect
- 1.3K Connectors
- 308 Workbench
- 6 Cloud Amplifier
- 10 Federated
- 3.8K Transform
- 660 Datasets
- 117 SQL DataFlows
- 2.2K Magic ETL
- 815 Beast Mode
- 3.3K Visualize
- 2.5K Charting
- 84 App Studio
- 46 Variables
- 780 Automate
- 191 Apps
- 482 APIs & Domo Developer
- 84 Workflows
- 23 Code Engine
- 41 AI and Machine Learning
- 20 AI Chat
- 1 AI Playground
- 2 AI Projects and Models
- 18 Jupyter Workspaces
- 413 Distribute
- 121 Domo Everywhere
- 281 Scheduled Reports
- 11 Software Integrations
- 146 Manage
- 142 Governance & Security
- 8 Domo Community Gallery
- 49 Product Releases
- 12 Domo University
- 5.4K Community Forums
- 41 Getting Started
- 31 Community Member Introductions
- 115 Community Announcements
- 4.8K Archive