Compare two peer groups

Hi, I'm not sure if this is possible using DOMO native toolset. I would love to be able to compare two peers groups performance against each other. A super simple select and compare of two things dynamically.
For example if this is my data:
Campaign | Money Made
A | $5
B | $10
C | $20
D | $5
How can I create a card where I can mix/match compare on one chart? Something like the screenshot below.

Basically what I'd like to do is create a filter that's called 'Campaign Group 1' and be able to select A and B. Then have another filter celled 'Campaign Group 2' and select C and D. Then have the chart show two bars -- one showing how Campaign Group 1 performed and one showing how Campaign Group 2 performs.
I know I can make variables that allow selection of specific hard coded strings, but I don't really see a dynamic variable option where I can have two selections based on string values that are in the dataset and it's not feasible to input tons of list items (campaigns) manually.
Hoping there's an easy solution! Thanks all.
Best Answer
-
It's a pretty interesting scenario. Quick disclaimer that I haven't gotten deep into Variables yet so this would be my old school workaround.
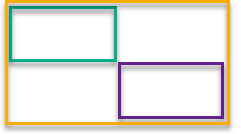
If you can afford to be a little wasteful and not bumping up against rows within your instance, I'd duplicate the dataset and append itself to itself, but with one set having column names changed to be "filter1.columnnames" and the other set of columns named "filter2.columnnames". (think of green box below as filter 1 rows/columns, purple box as filter 2 rows/columns, with the new yellow dataset being 2x the rows and 2x the columns of the original dataset) Then you could configure the filter1 to just look at the filter1.campaigns and filter2 to look at the filter2.campaigns, so that filter1.dollars and filter2.dollars could be represented as the first two series on the visualization and a beast that provides the variance series as deltas between the two dollar values. (you're just going to need to decide whether you want the variance to be group1 minus group 2 or group2-group1)
 1
1

Answers
-
Have you looked into the new Variables that Domo just deployed to dynamically change your values?
https://domohelp.domo.com/hc/en-us/articles/7903767835031-Variables-Overview
**Was this post helpful? Click Agree or Like below**
**Did this solve your problem? Accept it as a solution!**0 -
@GrantSmith thanks for your reply. I did look into this but it doesn't seem to be able to solve the business problem.
Variables appear to be extremely useful if I need to pick a number or a date, however when it comes to strings they appear to be extremely limited. Very powerful if I want to build a button that says pick units or dollars, far less useful and highly manual if I have 1000+ campaigns, it appears to only offer the ability to 'hand key' a few custom selections on strings rather than being able to filter on the same field two different ways.
I also looked at FIXED functions would not be helpful here, because while it allows for filter removal and adding, it's 'all or nothing' logic so I can't compare two samples of a field filtered two different ways. For example I can compare Texas vs the United States, but I cannot compare 'Texas and Oklahoma' vs 'Florida and Georgia'.
This is turning into quite the head scratcher.
0 -
@GrantSmith thanks for your reply. I did look into this but it doesn't seem to solve the business problem.
Variables appear to be extremely useful if I need to pick a number or a date, however when it comes to strings they appear to be extremely limited. Very powerful if I want to build a button that says pick units or dollars figures, far less useful and highly manual if I have 1000+ campaigns that are named different things, it appears to only offer the ability to 'hand key' a few custom selections on strings rather than being able to filter on the same field two different ways.
I also looked at FIXED functions but they would not be helpful here, because while it allows for filter removal and adding, it's 'all or nothing' logic so I can't compare two samples of a field filtered two different ways. For example I can compare Texas vs the United States, but I cannot compare 'Texas and Oklahoma' vs 'Florida and Georgia'.
This is turning into quite the head scratcher.
2 -
It's a pretty interesting scenario. Quick disclaimer that I haven't gotten deep into Variables yet so this would be my old school workaround.
If you can afford to be a little wasteful and not bumping up against rows within your instance, I'd duplicate the dataset and append itself to itself, but with one set having column names changed to be "filter1.columnnames" and the other set of columns named "filter2.columnnames". (think of green box below as filter 1 rows/columns, purple box as filter 2 rows/columns, with the new yellow dataset being 2x the rows and 2x the columns of the original dataset) Then you could configure the filter1 to just look at the filter1.campaigns and filter2 to look at the filter2.campaigns, so that filter1.dollars and filter2.dollars could be represented as the first two series on the visualization and a beast that provides the variance series as deltas between the two dollar values. (you're just going to need to decide whether you want the variance to be group1 minus group 2 or group2-group1)
1 -
@Billobi thanks! I think that will work, this actually exactly how I handle looking at same time last year and forward looking prior year analysis flexibly. The only issue (to your point) is it's a clunky and awkward way of ETLing the data.
I'd love for DOMO Team to develop a solution more custom tailored to addressing this type of scenario in the future, especially because the usecase are incredibly powerful and numerous.
Love your work around idea. Thanks for your help.
0 -
@G_Grey glad this did the trick for you! I'm hopeful that Variables could help with something like this once we're all more familiar with how they work with controls and such. Quick ETL snapshot below for anyone who comes along this thread in the future (I didn't mean to actually duplicate the dataset, just meant double it up in ETL but I think you got what I was going for) 😎
 0
0 -
@Billobi can you expand on this concept a little bit more. I've been tinkering and I'm running into an issue where, even with fixed functions, if because Campaign1 and Campaign2 don't share at least one common row the chart bombs out.

This is the dummy dataset I made

Gave myself a lot of options for summing.
1 -
@G_Grey and @Billobi did you guys end up solving this? I'm running into the exact same issue that you encountered @G_Grey.
The only solution I came up with logically is a full outer join of the two datasets rather than an append. You can set the MAX(Money1) for the benchmark and then the AVG(Money2) for the peer group. However, if your input dataset is too large, it creates a behemoth of an output dataset and is not practical at all. I'm dealing with a 200k row input dataset.
Ran into the same issue with variables being limited. I have 200+ unique string dimensions I'd need included in the variable control which also is impractical.
0 -
@Scotsman143 -- I did find a solution but it's not the most ideal. As long as the filters contain one 'like row' then the dynamic filtering works properly. Even if the field is null.
So, here's my dataset:

Then I do some beastmodes -- such as this one that takes a var:
SUM(SUM(`Whacks On`) FIXED (FILTER ALLOW `Campaign`)) -
SUM(SUM(`Whacks On`) FIXED (FILTER ALLOW `Believe it or not Campaign again`))
And here's the working visual:

It works as long as my users always include rum in the situation.
0 -
@G_Grey Thank you! I got it to work as well, very neat solution. Very weird that they need to share that one row as a control (in your case, the "RumIsTheAnswer"). I'm unsure if I'll stick with this solution because of the need to include the control in the filter. Not ideal for my customers. @Domo please take a look at this!
One note for those that may find this, make sure your control record is repeated for each dimension you want to visualize by. So my visual I am measuring by date, so you'll need a control record for each date. In my case I have a shared record between my "campaigns" as "CONTROL(do not touch)" repeated roughly for each unique date in my dataset (so I have roughly 300 "control" records), like so:
 0
0


Categories
- All Categories
- 1.4K Product Ideas
- 1.4K Ideas Exchange
- 1.4K Connect
- 1.2K Connectors
- 284 Workbench
- 4 Cloud Amplifier
- 4 Federated
- 2.9K Transform
- 88 SQL DataFlows
- 554 Datasets
- 2.2K Magic ETL
- 3.3K Visualize
- 2.3K Charting
- 563 Beast Mode
- 9 App Studio
- 27 Variables
- 577 Automate
- 140 Apps
- 414 APIs & Domo Developer
- 22 Workflows
- 1 DomoAI
- 28 Predict
- 12 Jupyter Workspaces
- 16 R & Python Tiles
- 350 Distribute
- 90 Domo Everywhere
- 258 Scheduled Reports
- 2 Software Integrations
- 91 Manage
- 88 Governance & Security
- 9 Product Release Questions
- Community Forums
- 42 Getting Started
- 28 Community Member Introductions
- 85 Community Announcements
- 4.8K Archive