Assistance With Creating a Bar Line Graph

Hello, I am trying to figure out how to create a line graph / bar line that will give me the variance change year over year based number of claims per year.


I am not sure if there is an easy way/setting in Domo to automatically create a percent change YoY for me, or if I need a beast mode to do this.
I have tried the following formula and put it in my Y-Axis, but it didn't seem to work.
(Case when Year(`Open Date`) = Year(curdate()) then `Claim Type` end / Case when Year(`Open Date`) = Year(curdate())-1 then `Claim Type`end) -1
Data:
I have an Open Date column and I am basically just counting the number of claim types each year. I am hopefully trying to get for example:
% Change from 2008->2009 from 665->818 ~ 23% increase..
2009->2010 ~ 818->511 ~ 37% decrease
Answers
-
Hi @SLam
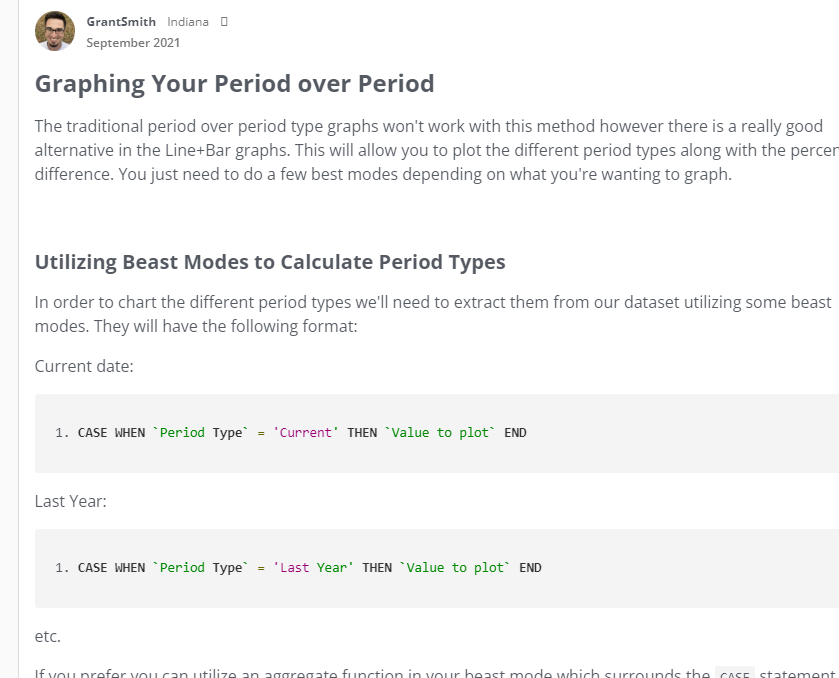
I'd recommend reformatting your data with a date offset dimension dataset and using a beast mode to calculate the different between last year and this year. I've written about this before here: https://dojo.domo.com/main/discussion/53481/a-more-flexible-way-to-do-period-over-period-comparisons#latest
You can then use a Line + Bar chart to define the YoY % values.
**Was this post helpful? Click Agree or Like below**
**Did this solve your problem? Accept it as a solution!**1 -
Hello @GrantSmith , thank you for the information.
Am I able to skip to the section below:
Or will I need to complete the above steps in order to complete the steps in the screenshot? I do not have access to MagicETL and MySQL to do these steps.
0

Categories
- All Categories
- 1.4K Product Ideas
- 1.4K Ideas Exchange
- 1.4K Connect
- 1.2K Connectors
- 284 Workbench
- 4 Cloud Amplifier
- 4 Federated
- 2.9K Transform
- 88 SQL DataFlows
- 554 Datasets
- 2.2K Magic ETL
- 3.3K Visualize
- 2.3K Charting
- 559 Beast Mode
- 7 App Studio
- 27 Variables
- 575 Automate
- 139 Apps
- 413 APIs & Domo Developer
- 22 Workflows
- 1 DomoAI
- 28 Predict
- 12 Jupyter Workspaces
- 16 R & Python Tiles
- 350 Distribute
- 90 Domo Everywhere
- 258 Scheduled Reports
- 2 Software Integrations
- 91 Manage
- 88 Governance & Security
- 9 Product Release Questions
- Community Forums
- 41 Getting Started
- 27 Community Member Introductions
- 85 Community Announcements
- 4.8K Archive