Box plot - different series

I would like to see in a boxplot different series to compare. Is that possible?
Thanks in advance!

Comments
-
@javiermolina Yes, you can do this by adding the series you want to the "Category Names" section in Analyzer
0 -
Don't know if I understood correctly. Category name only allows me to have 1 column. As well as the 'Containing data set'
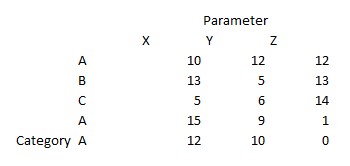
My example is the following:
I want to compare the box plot for only Category A but Parameters X, Y and Z
 0
0 -
@javiermolina The box plot chart only allows one series, so I recommend setting "Parameter" as your series and adding a "Category" quick filter. Alternatively, you can create multiple cards for the same dashboard and filter each one to a different category.
0 -
Can you explain me further on your solution. I can not set parameter as the series, It has to be either x, y or z as those are the columns that are retrieving the data (meaning, only one box plot). I don't want to create multiple cards because that would mean to modify each graph individually.
Can we make the suggestion to the development team?
Thanks for all the help
0 -
@javiermolina Based on your table, I interpreted "Parameter" to be the name of the field, where X, Y, and Z are the values of that field. Are you saying that X, Y, and Z are field names?
0

Categories
- All Categories
- 1.4K Product Ideas
- 1.4K Ideas Exchange
- 1.4K Connect
- 1.2K Connectors
- 284 Workbench
- 4 Cloud Amplifier
- 4 Federated
- 2.9K Transform
- 88 SQL DataFlows
- 554 Datasets
- 2.2K Magic ETL
- 3.3K Visualize
- 2.3K Charting
- 564 Beast Mode
- 9 App Studio
- 27 Variables
- 577 Automate
- 140 Apps
- 414 APIs & Domo Developer
- 22 Workflows
- 1 DomoAI
- 28 Predict
- 12 Jupyter Workspaces
- 16 R & Python Tiles
- 350 Distribute
- 90 Domo Everywhere
- 258 Scheduled Reports
- 2 Software Integrations
- 91 Manage
- 88 Governance & Security
- 9 Product Release Questions
- Community Forums
- 42 Getting Started
- 28 Community Member Introductions
- 85 Community Announcements
- 4.8K Archive