How to create a card that includes top 3 rows (based on top 3 values)?

I an trying to create a card that shows the top 3 reasons for termination based on the number of responses for each reason; I would also need it to show all other reasons when you drill down.
The dataset has 2 columns: Reason for termination (10+ reasons), number of responses.
Thank you in advance!
Best Answers
-
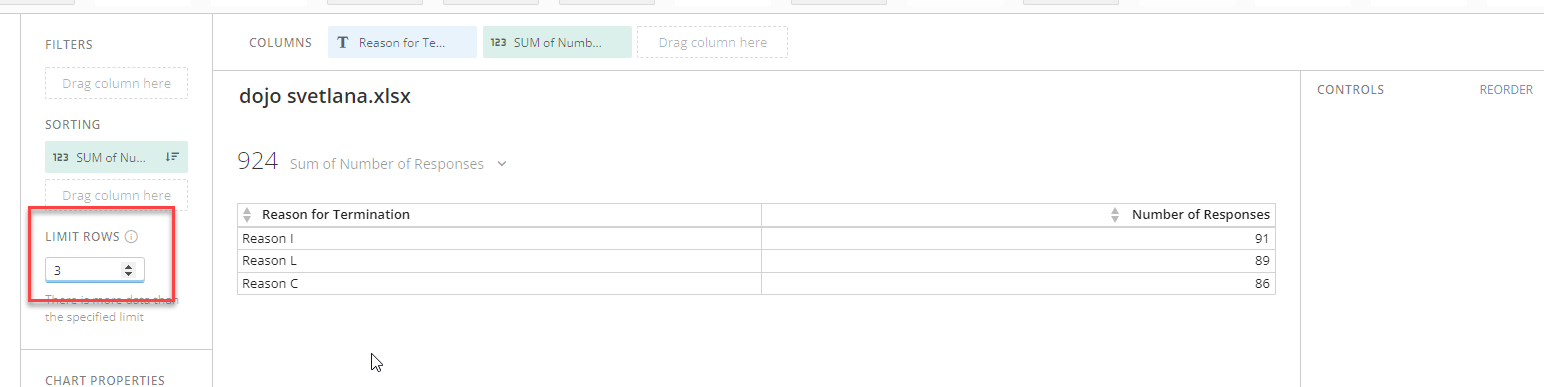
You can use a table card and sort on the number of responses ands then in the analyzer settings under filter you can set the number of rows to return to 3.
Doing a drill path to get all of the reasons will be difficult as Domo automatically filters your drill card based on what was selected
**Was this post helpful? Click Agree or Like below**
**Did this solve your problem? Accept it as a solution!**0 -
Hi @svetlana
You could always use a Pie or Donut Chart. Just in the General Chart Properties enter 3 as the maximum slices:


You can even get more details on the "Other" category by just moving your mouse over that pie piece:

“There is a superhero in all of us, we just need the courage to put on the cape.” -Superman2


Answers
-
You can use a table card and sort on the number of responses ands then in the analyzer settings under filter you can set the number of rows to return to 3.
Doing a drill path to get all of the reasons will be difficult as Domo automatically filters your drill card based on what was selected
**Was this post helpful? Click Agree or Like below**
**Did this solve your problem? Accept it as a solution!**0 -
Thank you @GrantSmith! It doesn't look like I have the option to return 3 rows in the filter section though, maybe it's somewhere else?
0 -
Hi @svetlana
You could always use a Pie or Donut Chart. Just in the General Chart Properties enter 3 as the maximum slices:
You can even get more details on the "Other" category by just moving your mouse over that pie piece:
“There is a superhero in all of us, we just need the courage to put on the cape.” -Superman2 -
@ST_-Superman-_ Thank you so much for including the screen shots, it's a great idea and gets the job done :)
0 -
Using a table card per @GrantSmith you can do something like this:
In this case, I added a Pareto to the drill path, but there is one extra step required in order to view all of the categories. You need to first drill into a single reason,

And then click on the "x" to remove the filter:

Conversely, you could just have the top three table card displayed above this pareto in a dashboard layout:

“There is a superhero in all of us, we just need the courage to put on the cape.” -Superman1
Categories
- All Categories
- 1.4K Product Ideas
- 1.4K Ideas Exchange
- 1.4K Connect
- 1.2K Connectors
- 284 Workbench
- 4 Cloud Amplifier
- 4 Federated
- 2.9K Transform
- 88 SQL DataFlows
- 554 Datasets
- 2.2K Magic ETL
- 3.3K Visualize
- 2.3K Charting
- 564 Beast Mode
- 9 App Studio
- 27 Variables
- 577 Automate
- 140 Apps
- 414 APIs & Domo Developer
- 22 Workflows
- 1 DomoAI
- 28 Predict
- 12 Jupyter Workspaces
- 16 R & Python Tiles
- 350 Distribute
- 90 Domo Everywhere
- 258 Scheduled Reports
- 2 Software Integrations
- 91 Manage
- 88 Governance & Security
- 9 Product Release Questions
- Community Forums
- 42 Getting Started
- 28 Community Member Introductions
- 85 Community Announcements
- 4.8K Archive