I need to calculate cumulative backlog in card for the data filtered by various categories and date


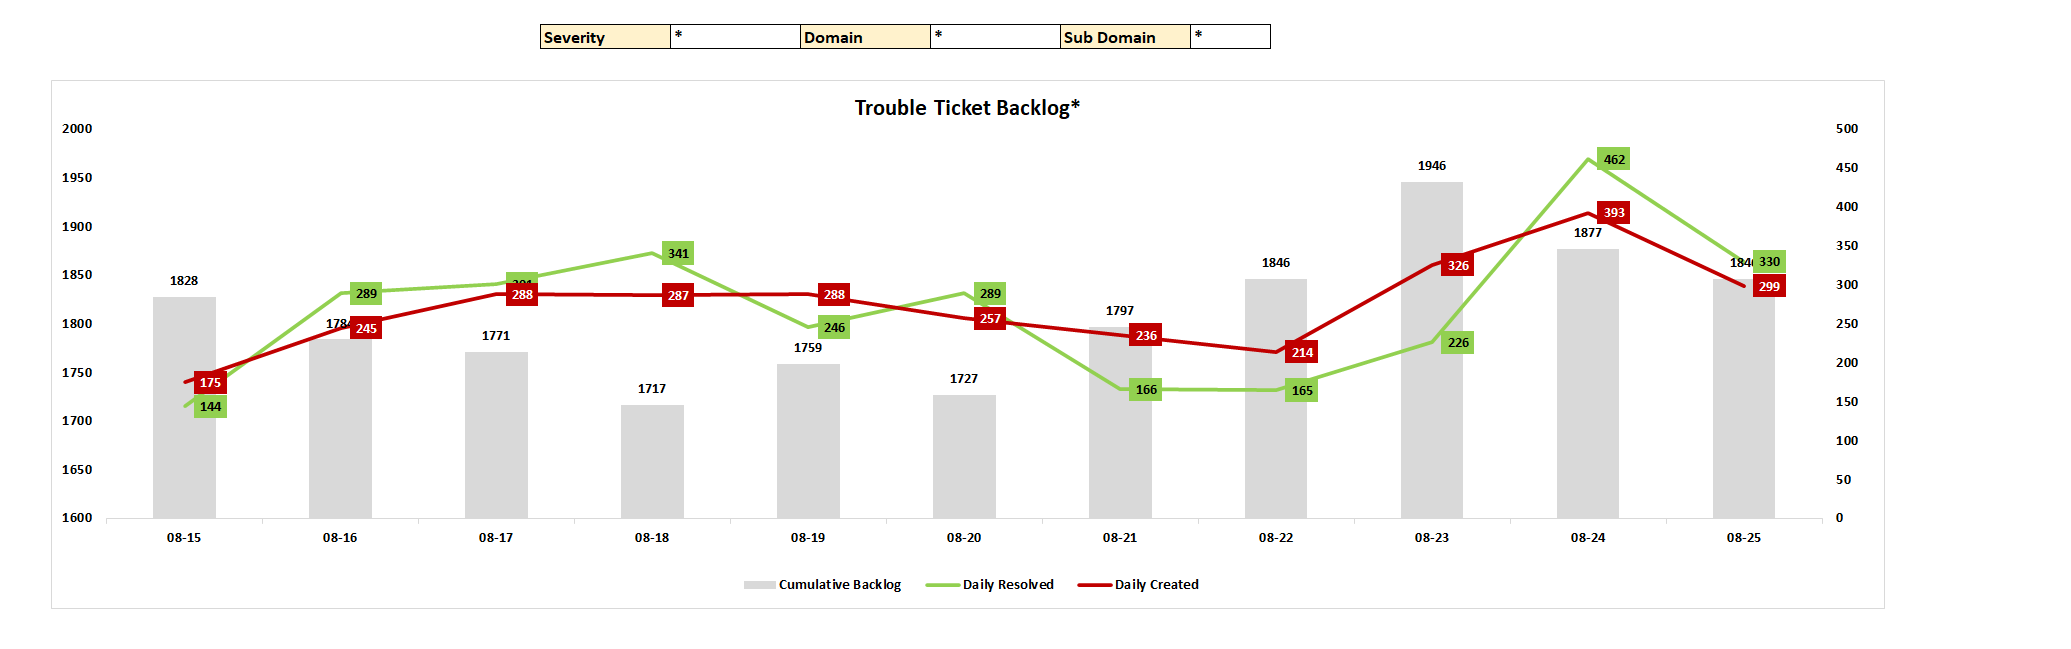
This is the data for my chart. I have to show ticket created count ,ticket closed count and cumulative backlog count datewise . The dynamic filters are severity, domain, sub domain and date. The chart has to be look like below. The below chart is taken from excel report. I have to achieve this in domo. please provide ideas .
0
Answers
-
Hi @mahee84, in order to get that graph view, follow these steps:
- Select 'Line + grouped bar' in Chart Types
- Drag in your 'Cumulative Backlog' field in the X axis and then either Daily date fields in 1st Series spot and then the other Daily date field in 2nd Series column
- At the moment, it'll show as one bar and one graph so then you'll go into Chart Properties -> General -> Series on Left Scale and type in '2'
- Once applied, it'll show as 2 lines which then means you should add in your 'Ticket No' field to the 3rd Series column, resulting in a bar with two lines
- Afterwards, it's tidying up the y-axes in Chart Properties -> Value Scale, and other elements to match your Excel report.
8 -
cumulative backlog is just a window function
sum(sum(1)) over (order by date)
the trick is to know if on a date the ticket is still open
case when date<= closeDate then 1 else 0 end.
course this only works assuming you have a ticket on every single day or you might end up with gaps in your data.
https://www.youtube.com/watch?v=ZPf41Fjn1H8&t=592s
good luck!
Jae Wilson
Check out my 🎥 Domo Training YouTube Channel 👨💻
**Say "Thanks" by clicking the ❤️ in the post that helped you.
**Please mark the post that solves your problem by clicking on "Accept as Solution"0


Categories
- All Categories
- 1.4K Product Ideas
- 1.4K Ideas Exchange
- 1.4K Connect
- 1.2K Connectors
- 284 Workbench
- 4 Cloud Amplifier
- 4 Federated
- 2.9K Transform
- 88 SQL DataFlows
- 555 Datasets
- 2.2K Magic ETL
- 3.3K Visualize
- 2.3K Charting
- 568 Beast Mode
- 9 App Studio
- 27 Variables
- 577 Automate
- 140 Apps
- 414 APIs & Domo Developer
- 22 Workflows
- 1 DomoAI
- 28 Predict
- 12 Jupyter Workspaces
- 16 R & Python Tiles
- 350 Distribute
- 90 Domo Everywhere
- 258 Scheduled Reports
- 2 Software Integrations
- 91 Manage
- 88 Governance & Security
- 9 Product Release Questions
- Community Forums
- 42 Getting Started
- 28 Community Member Introductions
- 85 Community Announcements
- 4.8K Archive