Seismogram Tutorial

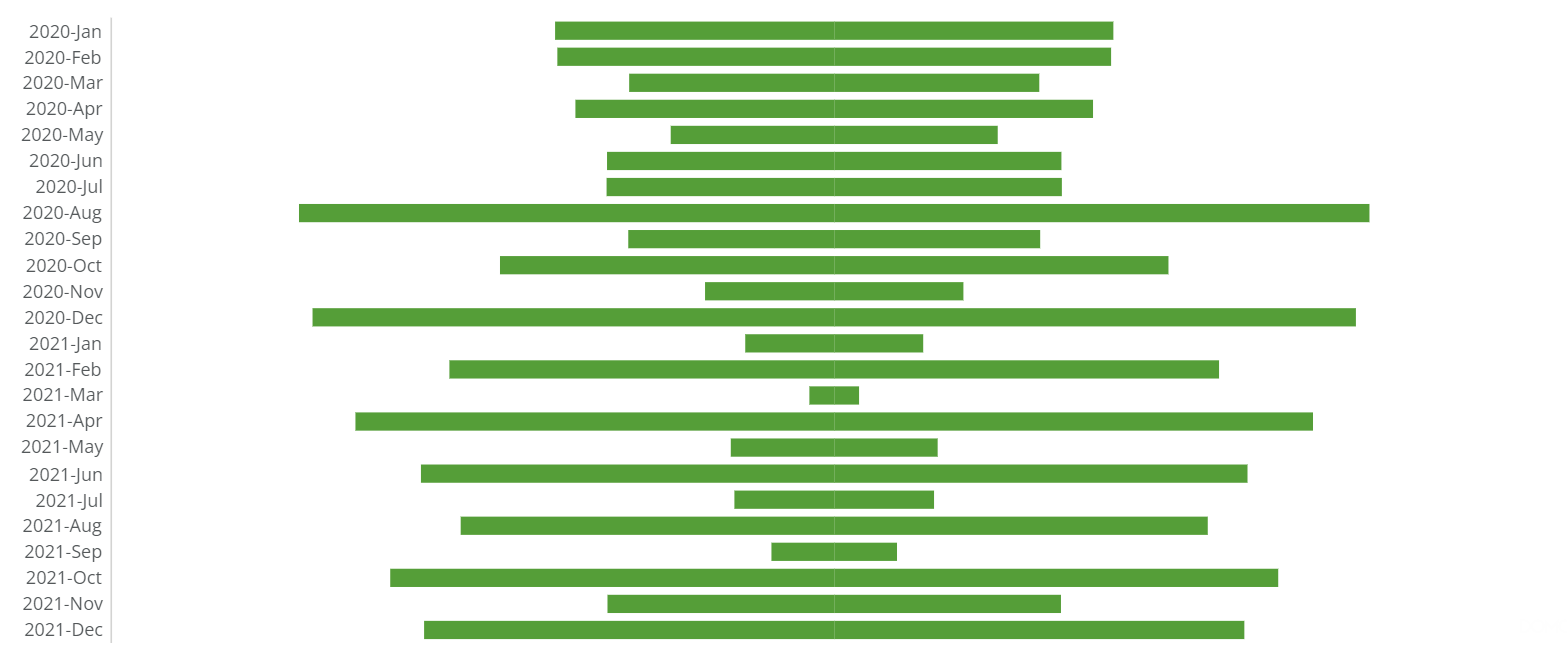
Another alternative to the circle timeline, the seismogram is good for showing series where there are big variations in the data.
How to build in Analyzer:
- Select 'Bar' under 'Popular Charts' as the Chart Type
- Create Calculated Field named '-Sales'
Sales/2 - Drag '-Sales' into 'X-Axis'
- Drag '-Sales' into 'Series'
- Turn on Tooltips. Drag 'Sales' into 'Tooltip Field 1'
- In Chart Properties, configure the following:
- Gridlines -> Zero Line Colour: White
- Gridlines -> 'Hide Gridlines' checked
- Gridlines -> 'Remove Min/Max/Avg Lines' checked
- Value Scale (X) -> Show Label as 'Never'
- Hover Text Settings -> Hover Text as:
%_CATEGORY_NAME Sales ($): %_TOOLTIP1
Screenshot:

Tagged:
0
Categories
- All Categories
- 1.4K Product Ideas
- 1.4K Ideas Exchange
- 1.4K Connect
- 1.2K Connectors
- 284 Workbench
- 4 Cloud Amplifier
- 4 Federated
- 2.9K Transform
- 88 SQL DataFlows
- 555 Datasets
- 2.2K Magic ETL
- 3.3K Visualize
- 2.3K Charting
- 566 Beast Mode
- 9 App Studio
- 27 Variables
- 577 Automate
- 140 Apps
- 414 APIs & Domo Developer
- 22 Workflows
- 1 DomoAI
- 28 Predict
- 12 Jupyter Workspaces
- 16 R & Python Tiles
- 350 Distribute
- 90 Domo Everywhere
- 258 Scheduled Reports
- 2 Software Integrations
- 91 Manage
- 88 Governance & Security
- 9 Product Release Questions
- Community Forums
- 42 Getting Started
- 28 Community Member Introductions
- 85 Community Announcements
- 4.8K Archive